Open Access
Fig. 2
Download original image
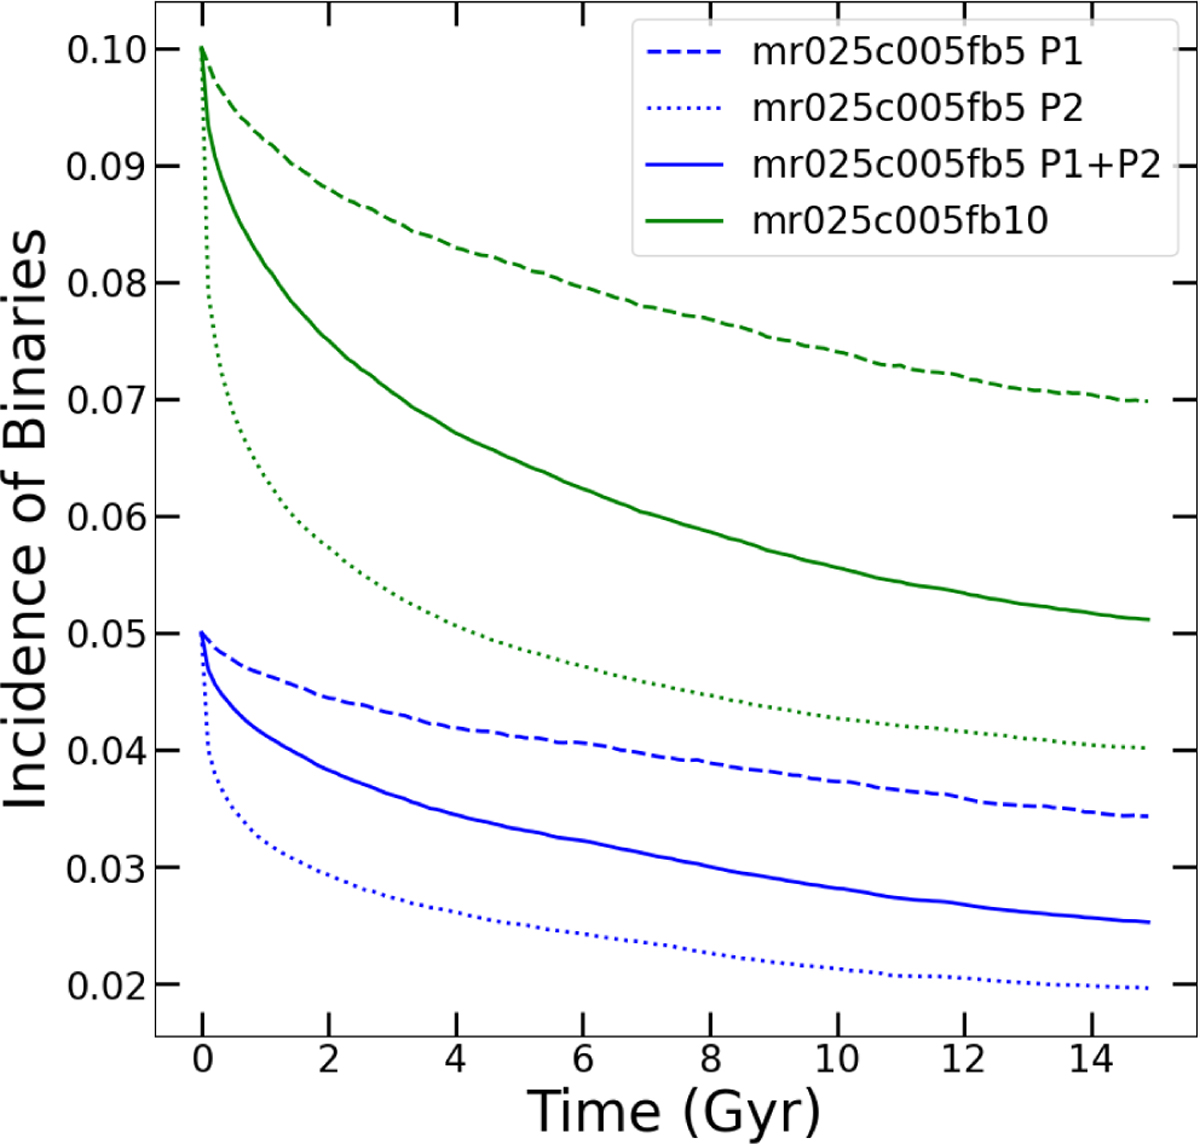
Time evolution of the global binary incidence within P1 (dashed line), within P2 (dotted line), and within all the stars in the cluster (P1+P2) (solid line). Incidence refers to the fraction of objects within each population that are binaries (see Eq. (3)).
Current usage metrics show cumulative count of Article Views (full-text article views including HTML views, PDF and ePub downloads, according to the available data) and Abstracts Views on Vision4Press platform.
Data correspond to usage on the plateform after 2015. The current usage metrics is available 48-96 hours after online publication and is updated daily on week days.
Initial download of the metrics may take a while.