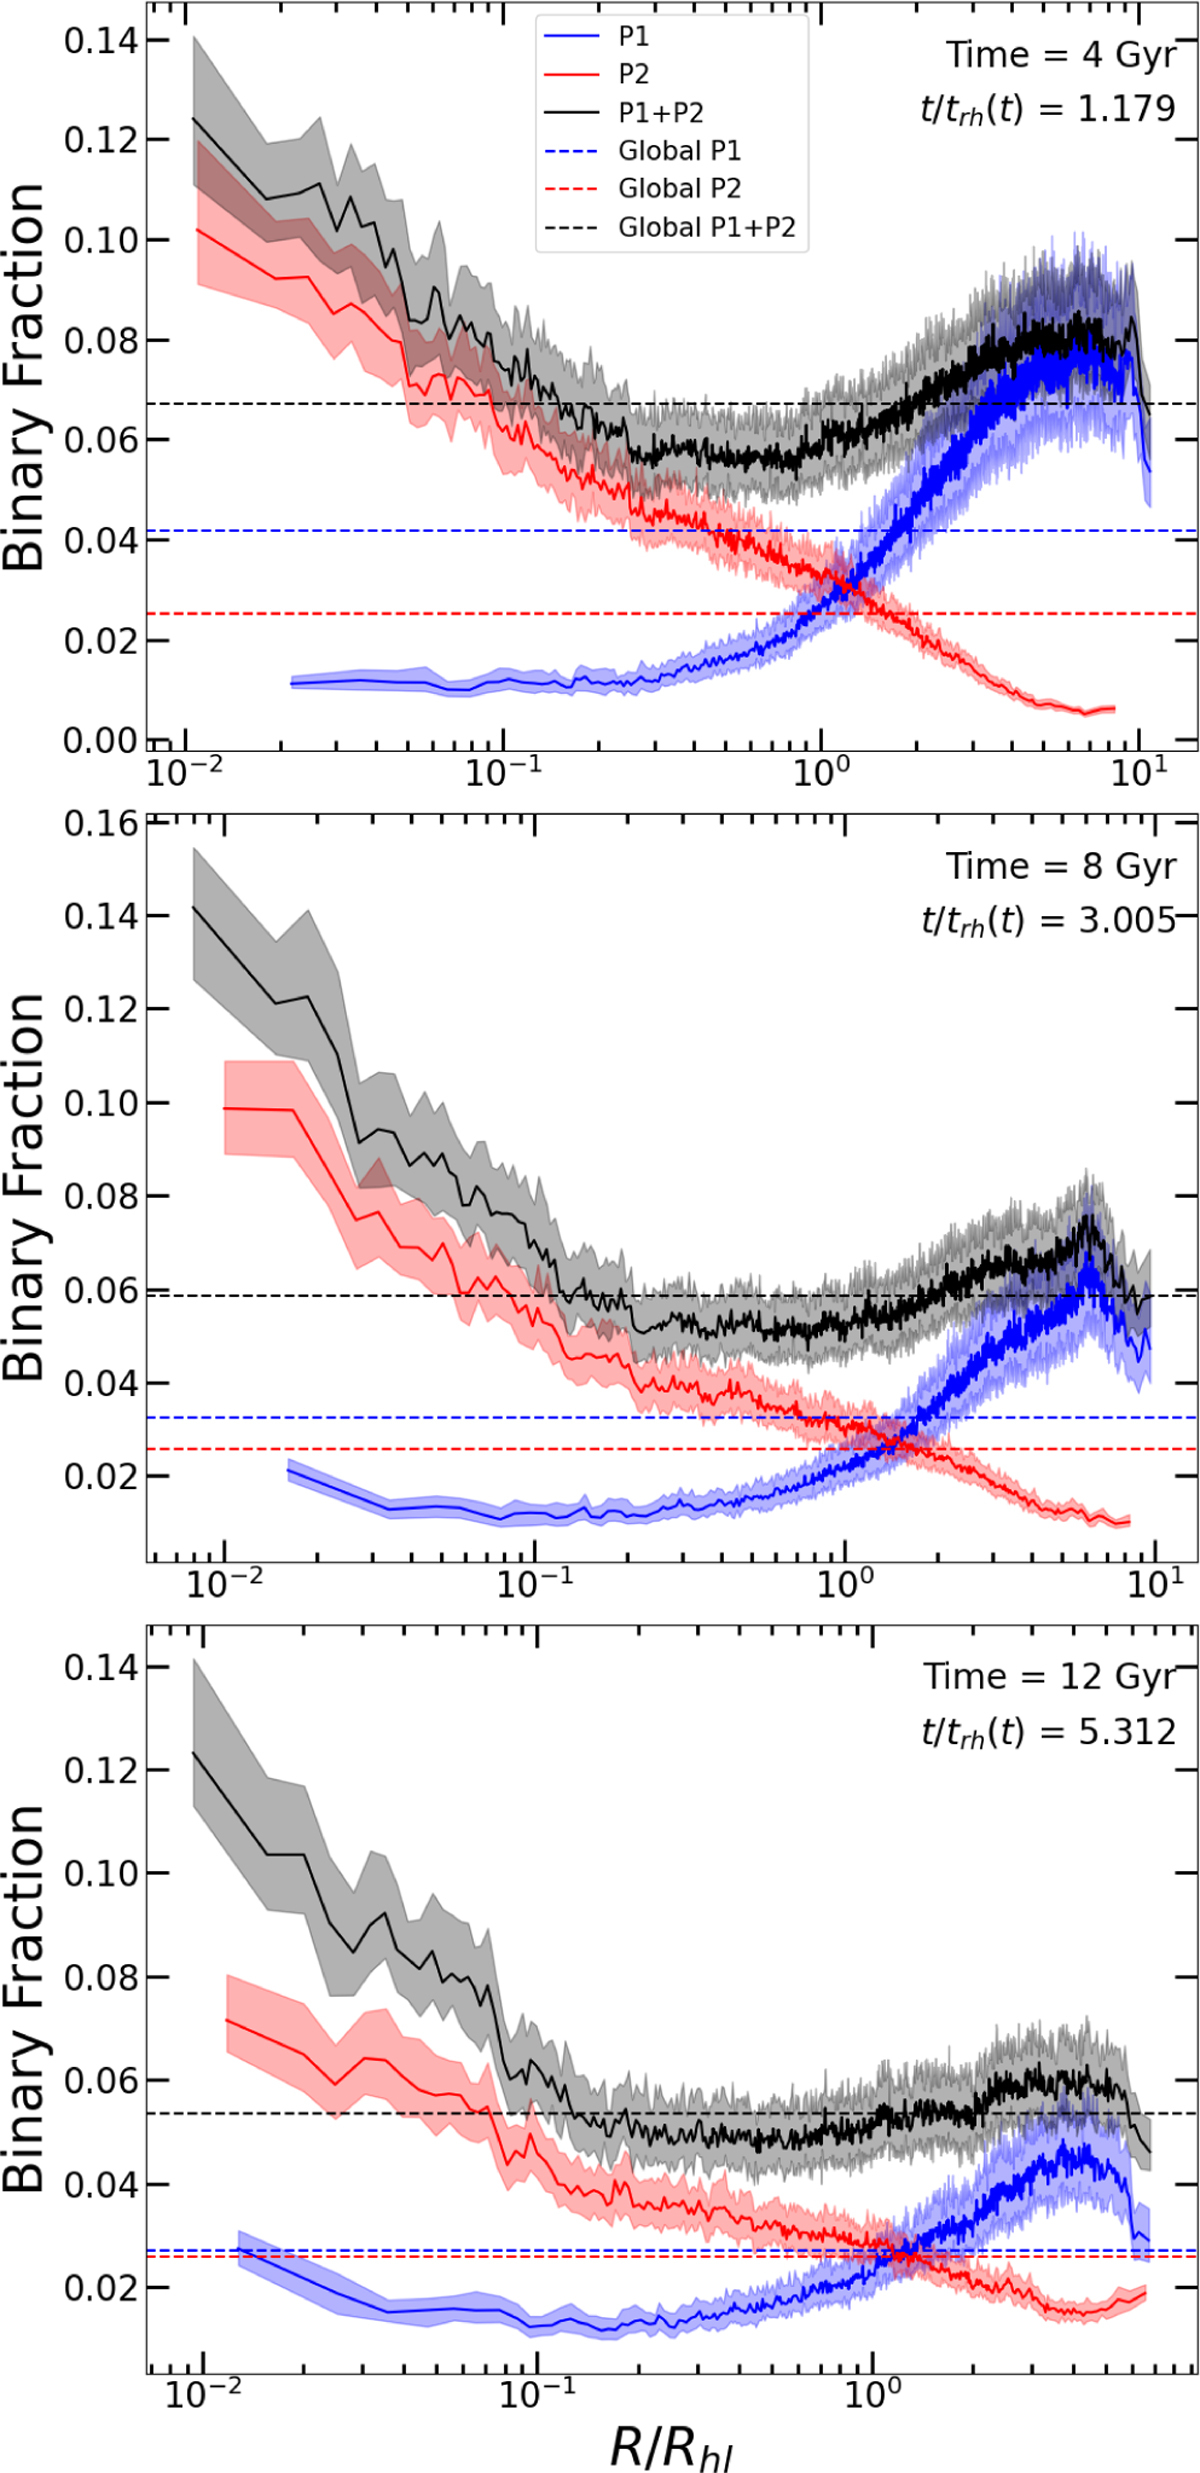
Fig. 7
Download original image
Radial profile of the fraction of binaries in P1 (blue), P2 (red), and both populations (black) evolved to 4 Gyr (top), 8 Gyr (middle), and 12 Gyr (bottom) for simulation mr025c005fb10. We report the median of 100 random realizations of the 2D spatial projection, with the shaded regions representing the 25th and 75th percentiles. The horizontal dashed lines represent the global value of the binary fraction for P1 (blue dashed line), P2 (red dashed line), and P1+P2 (black dashed line). Binary fraction refers to the fraction of objects within the total system that are binaries (see Eq. (4)).
Current usage metrics show cumulative count of Article Views (full-text article views including HTML views, PDF and ePub downloads, according to the available data) and Abstracts Views on Vision4Press platform.
Data correspond to usage on the plateform after 2015. The current usage metrics is available 48-96 hours after online publication and is updated daily on week days.
Initial download of the metrics may take a while.