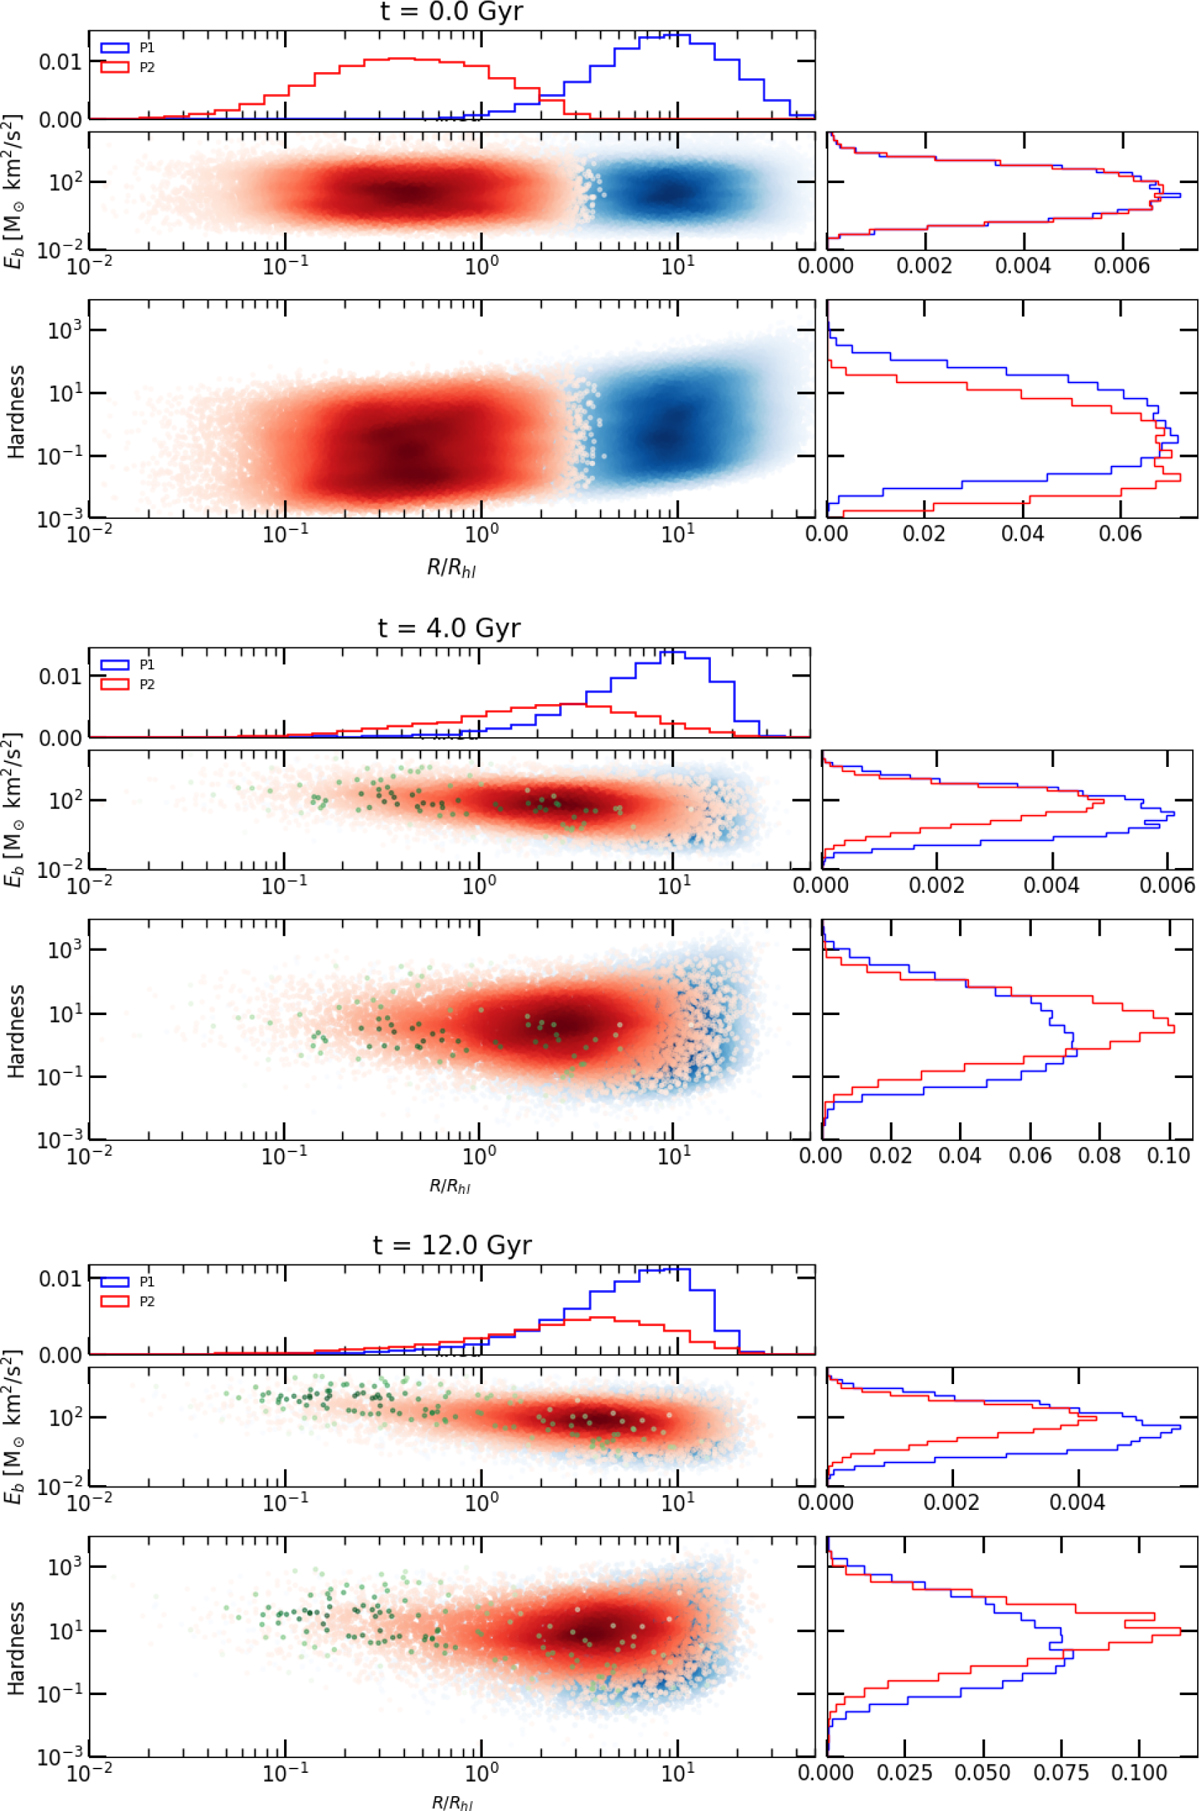
Fig. 8
Download original image
Radial density distributions of P1 binaries (blue), P2 binaries (red), and mixed binaries (green) compared to binding energy (top panel) and hardness (bottom panel) for simulation mr025c005fb10 at 0 Gyr (top plot), 4 Gyr (middle plot), and 12 Gyr (bottom plot). The top histogram shows the binaries in radial bins. The right side histograms show the binary distributions in binding energy bins (upper histogram) and hardness bins (lower histogram). All histograms are normalized such that the total area under the histogram equals 1.
Current usage metrics show cumulative count of Article Views (full-text article views including HTML views, PDF and ePub downloads, according to the available data) and Abstracts Views on Vision4Press platform.
Data correspond to usage on the plateform after 2015. The current usage metrics is available 48-96 hours after online publication and is updated daily on week days.
Initial download of the metrics may take a while.