Fig. 1
Download original image
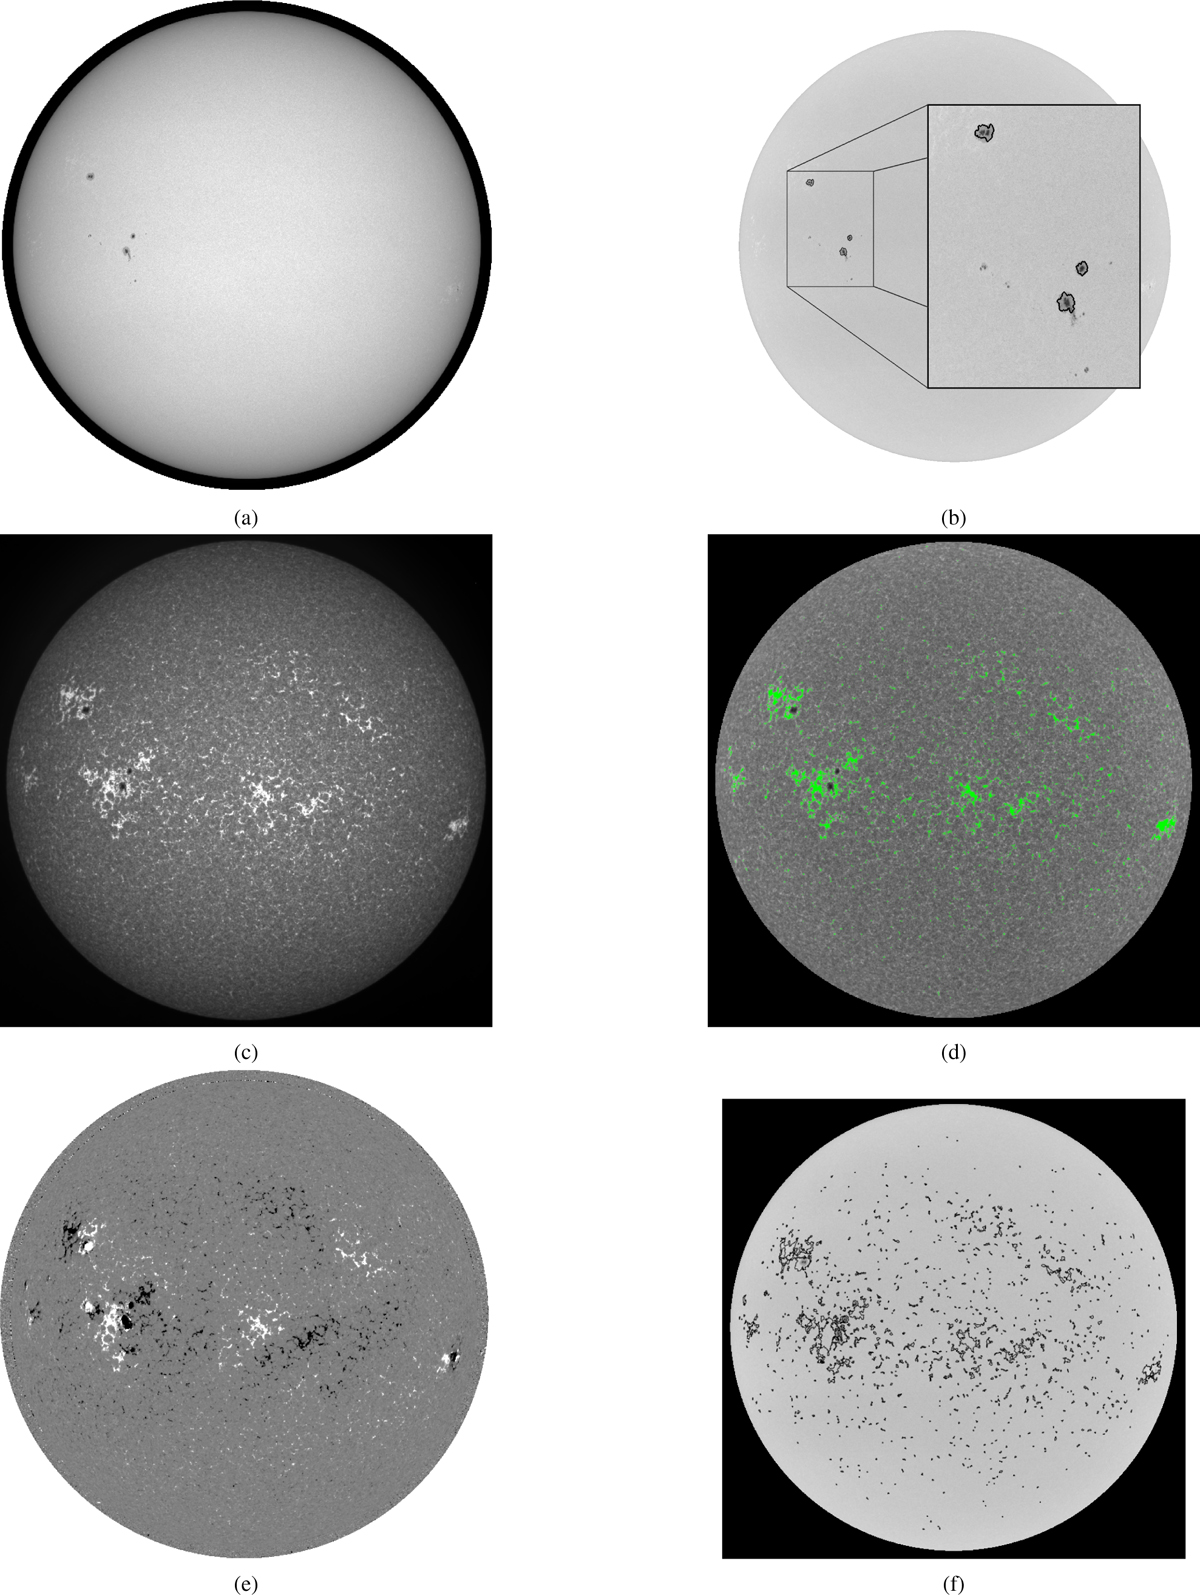
Left column: example of original SDO images from 11 August 2016: (a) HMI intensitygram, (c) HMI magnetogram, and (e) AIA UV image. Right column: corresponding active-region identifications for the same observation: (b) HMI intensitygram, (d) HMI magnetogram, and (f) AIA UV image. The contours mark the detected active regions.
Current usage metrics show cumulative count of Article Views (full-text article views including HTML views, PDF and ePub downloads, according to the available data) and Abstracts Views on Vision4Press platform.
Data correspond to usage on the plateform after 2015. The current usage metrics is available 48-96 hours after online publication and is updated daily on week days.
Initial download of the metrics may take a while.