Fig. B.1
Download original image
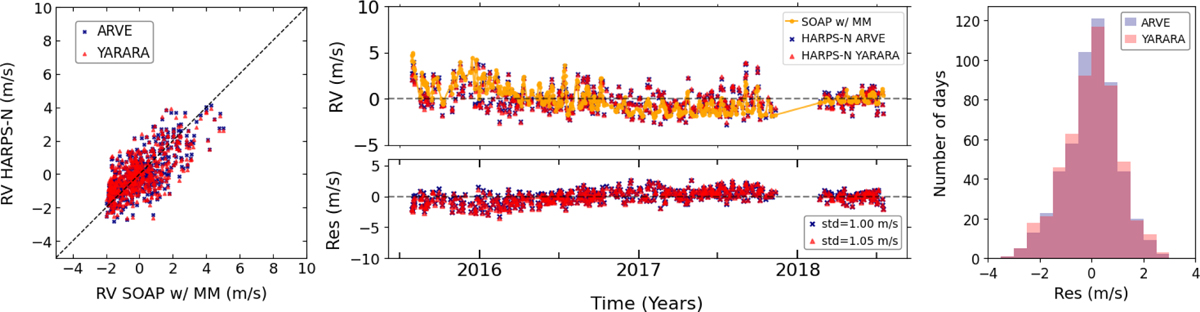
Left: Comparison of RVs from HARPS-N extracted with ARVE (blue) and with YARARA (red), and RV SOAPv4 simulations based on the MM method both for spots and plages (SOAP with MM). Middle: RV time series from HARPS-N ARVE (blue) and YARARA (red) and from SOAP with MM (yellow; top), together with the residuals, calculated as the difference between observed and simulated RVs and their std value (bottom). Right: Histogram of the residuals between SOAPv4 RVs and ARVE (blue) and between SOAPv4 RVs and YARARA (red).
Current usage metrics show cumulative count of Article Views (full-text article views including HTML views, PDF and ePub downloads, according to the available data) and Abstracts Views on Vision4Press platform.
Data correspond to usage on the plateform after 2015. The current usage metrics is available 48-96 hours after online publication and is updated daily on week days.
Initial download of the metrics may take a while.