Open Access
Fig. 3
Download original image
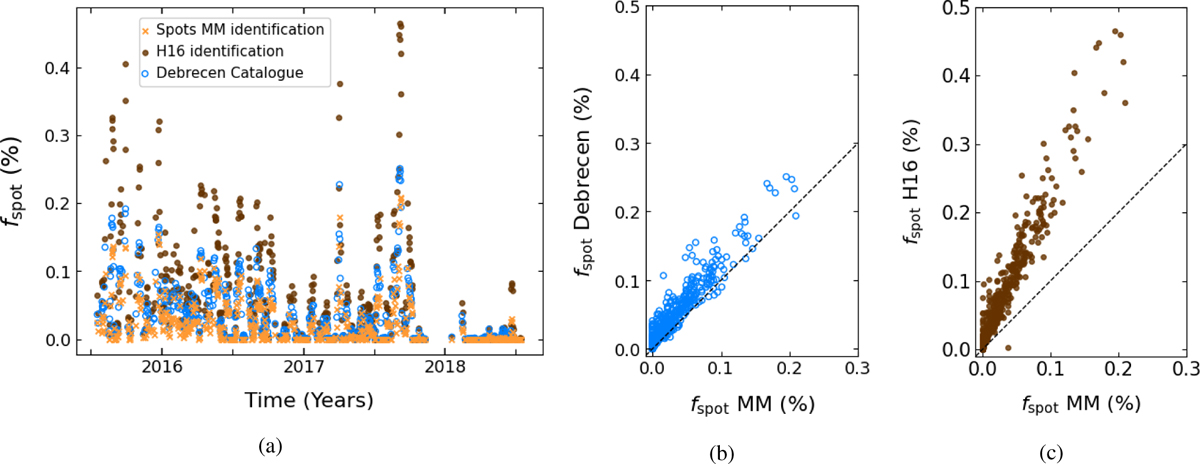
Comparison of the spot filling factors measured from MM on HMI images (orange), from the Debrecen catalogue (blue), and following H16 (brown). Panel a shows the temporal evolution of each, while panels b and c show, respectively, the latter two as a function of the former, which we take as reference in our sample.
Current usage metrics show cumulative count of Article Views (full-text article views including HTML views, PDF and ePub downloads, according to the available data) and Abstracts Views on Vision4Press platform.
Data correspond to usage on the plateform after 2015. The current usage metrics is available 48-96 hours after online publication and is updated daily on week days.
Initial download of the metrics may take a while.