Open Access
Fig. A.1
Download original image
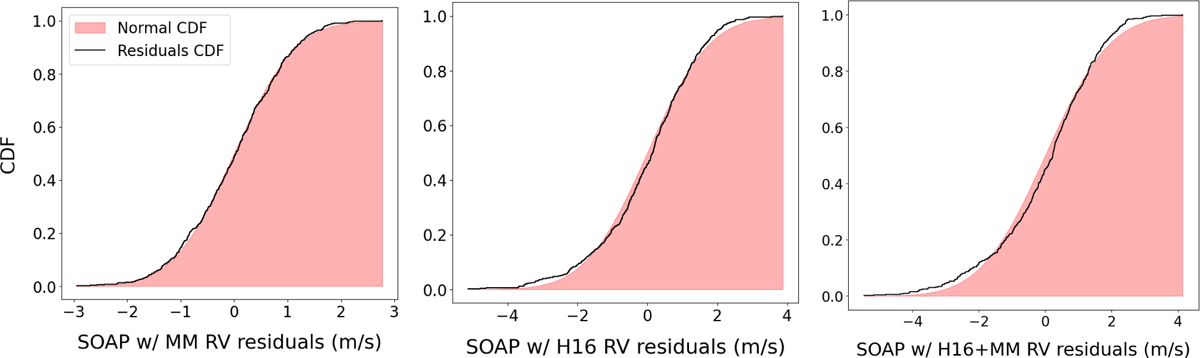
Left: Empirical CDF (black curve) of the RV residuals for the SOAPv4 simulation based on MM active-region identification. Middle: Same for the H16 identification. Right: Same for the combined H16+MM approach. In all panels, the shaded red area shows the cumulative distribution of the best-fitting normal distribution.
Current usage metrics show cumulative count of Article Views (full-text article views including HTML views, PDF and ePub downloads, according to the available data) and Abstracts Views on Vision4Press platform.
Data correspond to usage on the plateform after 2015. The current usage metrics is available 48-96 hours after online publication and is updated daily on week days.
Initial download of the metrics may take a while.