Open Access
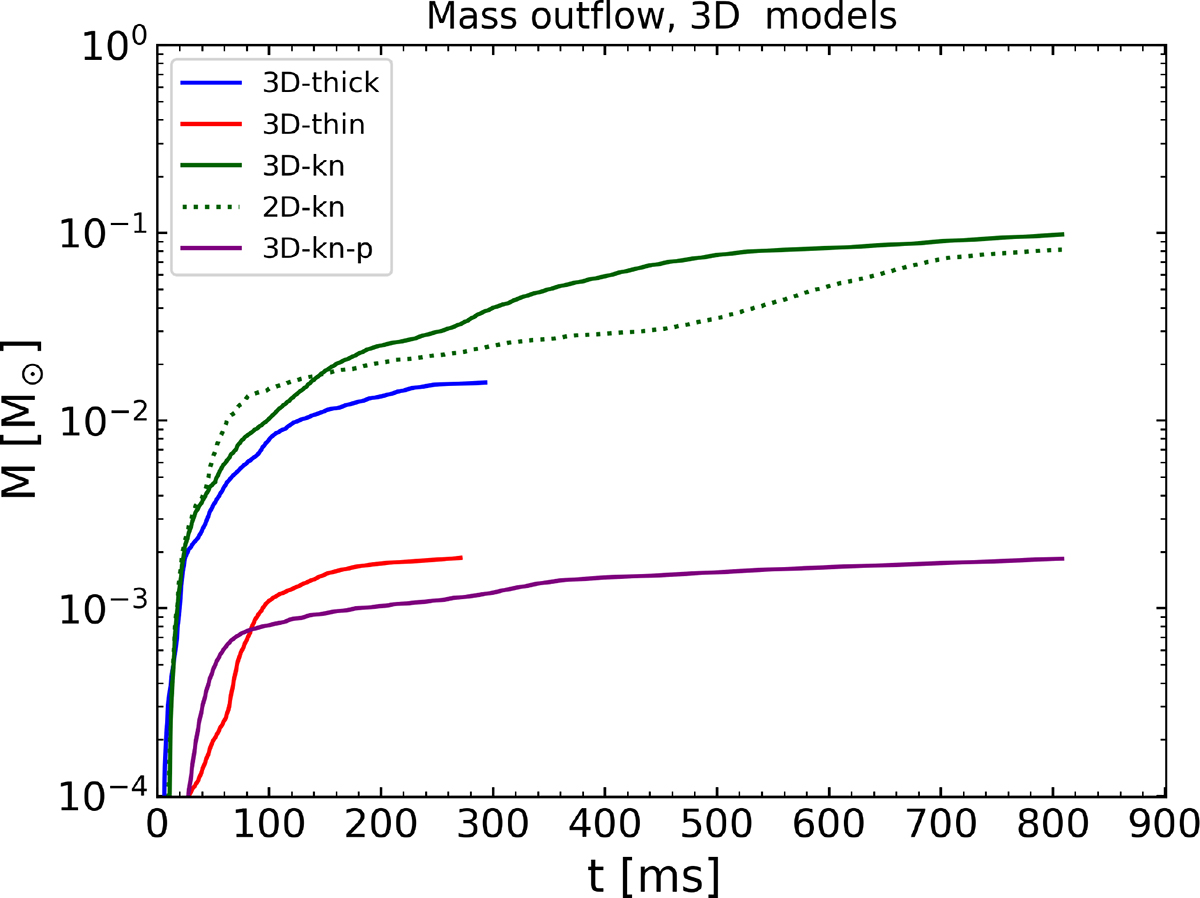
Fig. 12.
Download original image
Cumulative mass outflow from the outer boundary for the 3D models. The plot uses a logarithmic scale. The time expressed in physical units differs between the fiducial and “kn” models because of different tg values, while all models were evolved over the same duration in code units.
Current usage metrics show cumulative count of Article Views (full-text article views including HTML views, PDF and ePub downloads, according to the available data) and Abstracts Views on Vision4Press platform.
Data correspond to usage on the plateform after 2015. The current usage metrics is available 48-96 hours after online publication and is updated daily on week days.
Initial download of the metrics may take a while.