Open Access
Fig. 13.
Download original image
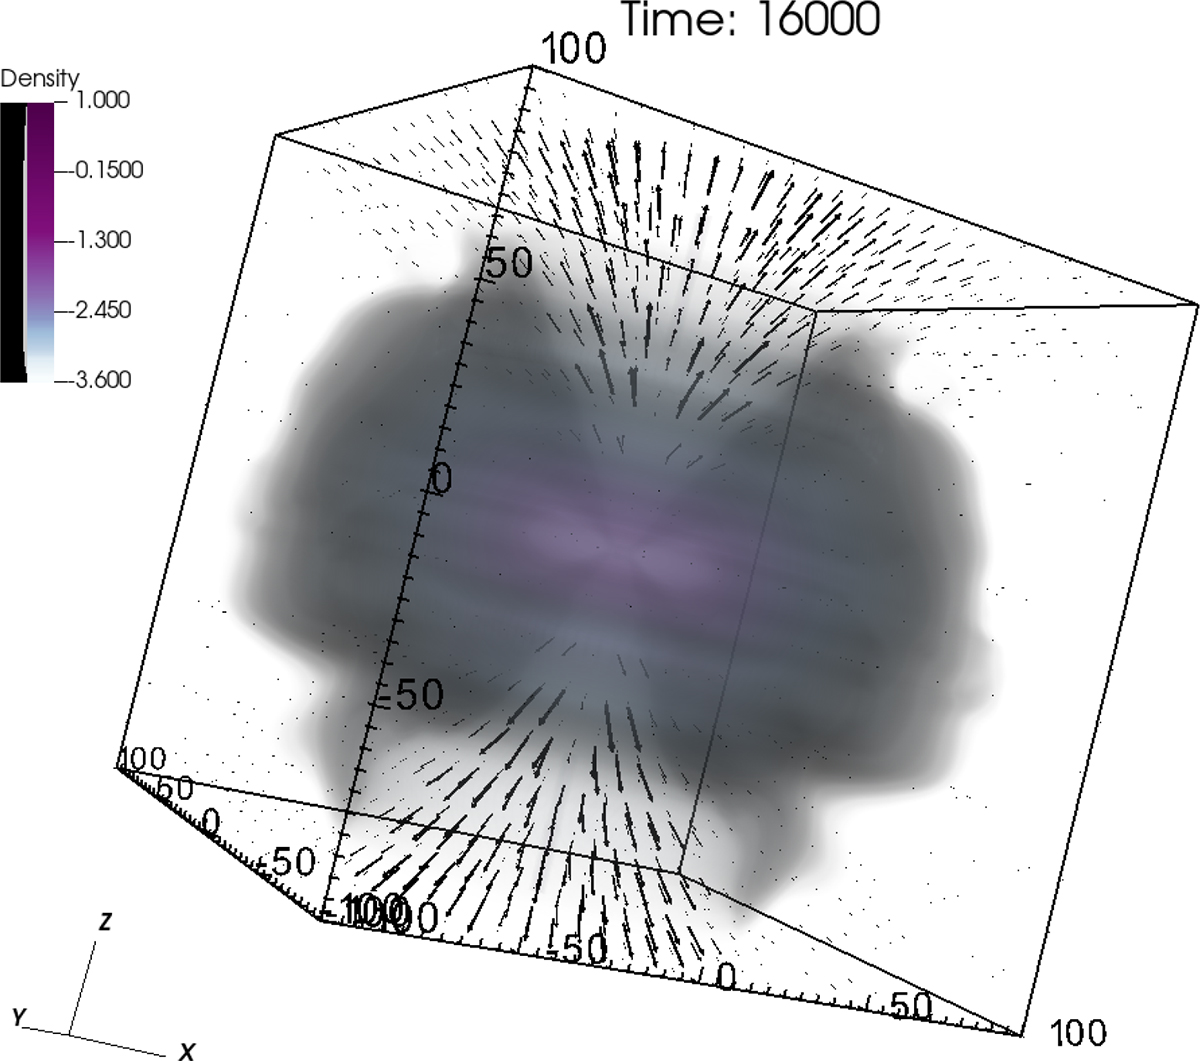
Volume rendering plot of the density with superimposed velocity field in the wind outflow. The plot shows axisymmetric kilonova model 3D-kn at the final time snapshot, t = 16 000tg. The density is plotted on a logarithmic scale, in code units.
Current usage metrics show cumulative count of Article Views (full-text article views including HTML views, PDF and ePub downloads, according to the available data) and Abstracts Views on Vision4Press platform.
Data correspond to usage on the plateform after 2015. The current usage metrics is available 48-96 hours after online publication and is updated daily on week days.
Initial download of the metrics may take a while.