Fig. 15.
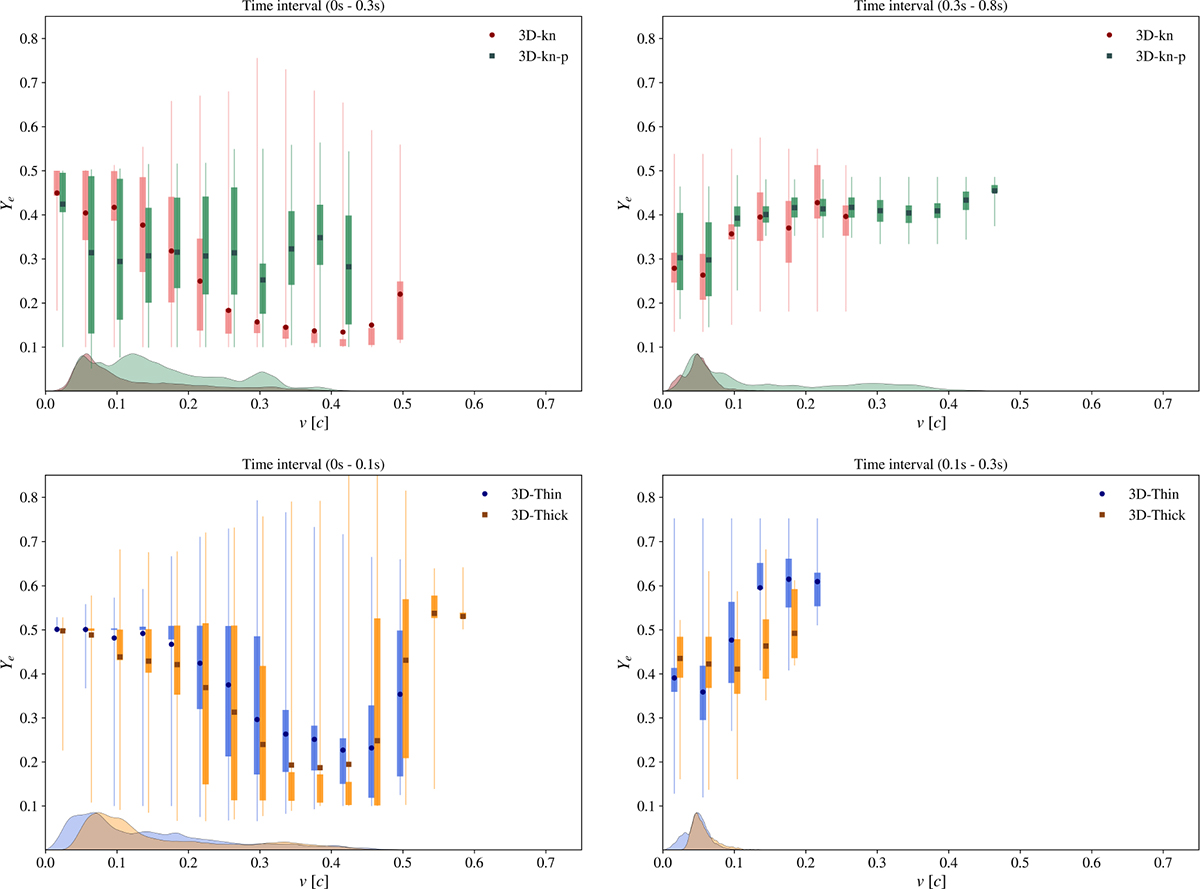
Download original image
Binned electron fraction (Ye) versus ejecta velocity (v), plotted for the 3D models shown in Fig. 14. Vertical bars indicate the full range (thin lines) and the interquartile range (thick bars) of Ye values in each velocity bin, with markers denoting the mean. The bottom ribbons show the kernel density estimate (KDE) of the velocity distribution for each model. The left and right panels show ejecta sampled at early and late periods of evolution, respectively.
Current usage metrics show cumulative count of Article Views (full-text article views including HTML views, PDF and ePub downloads, according to the available data) and Abstracts Views on Vision4Press platform.
Data correspond to usage on the plateform after 2015. The current usage metrics is available 48-96 hours after online publication and is updated daily on week days.
Initial download of the metrics may take a while.