Open Access
Fig. 2.
Download original image
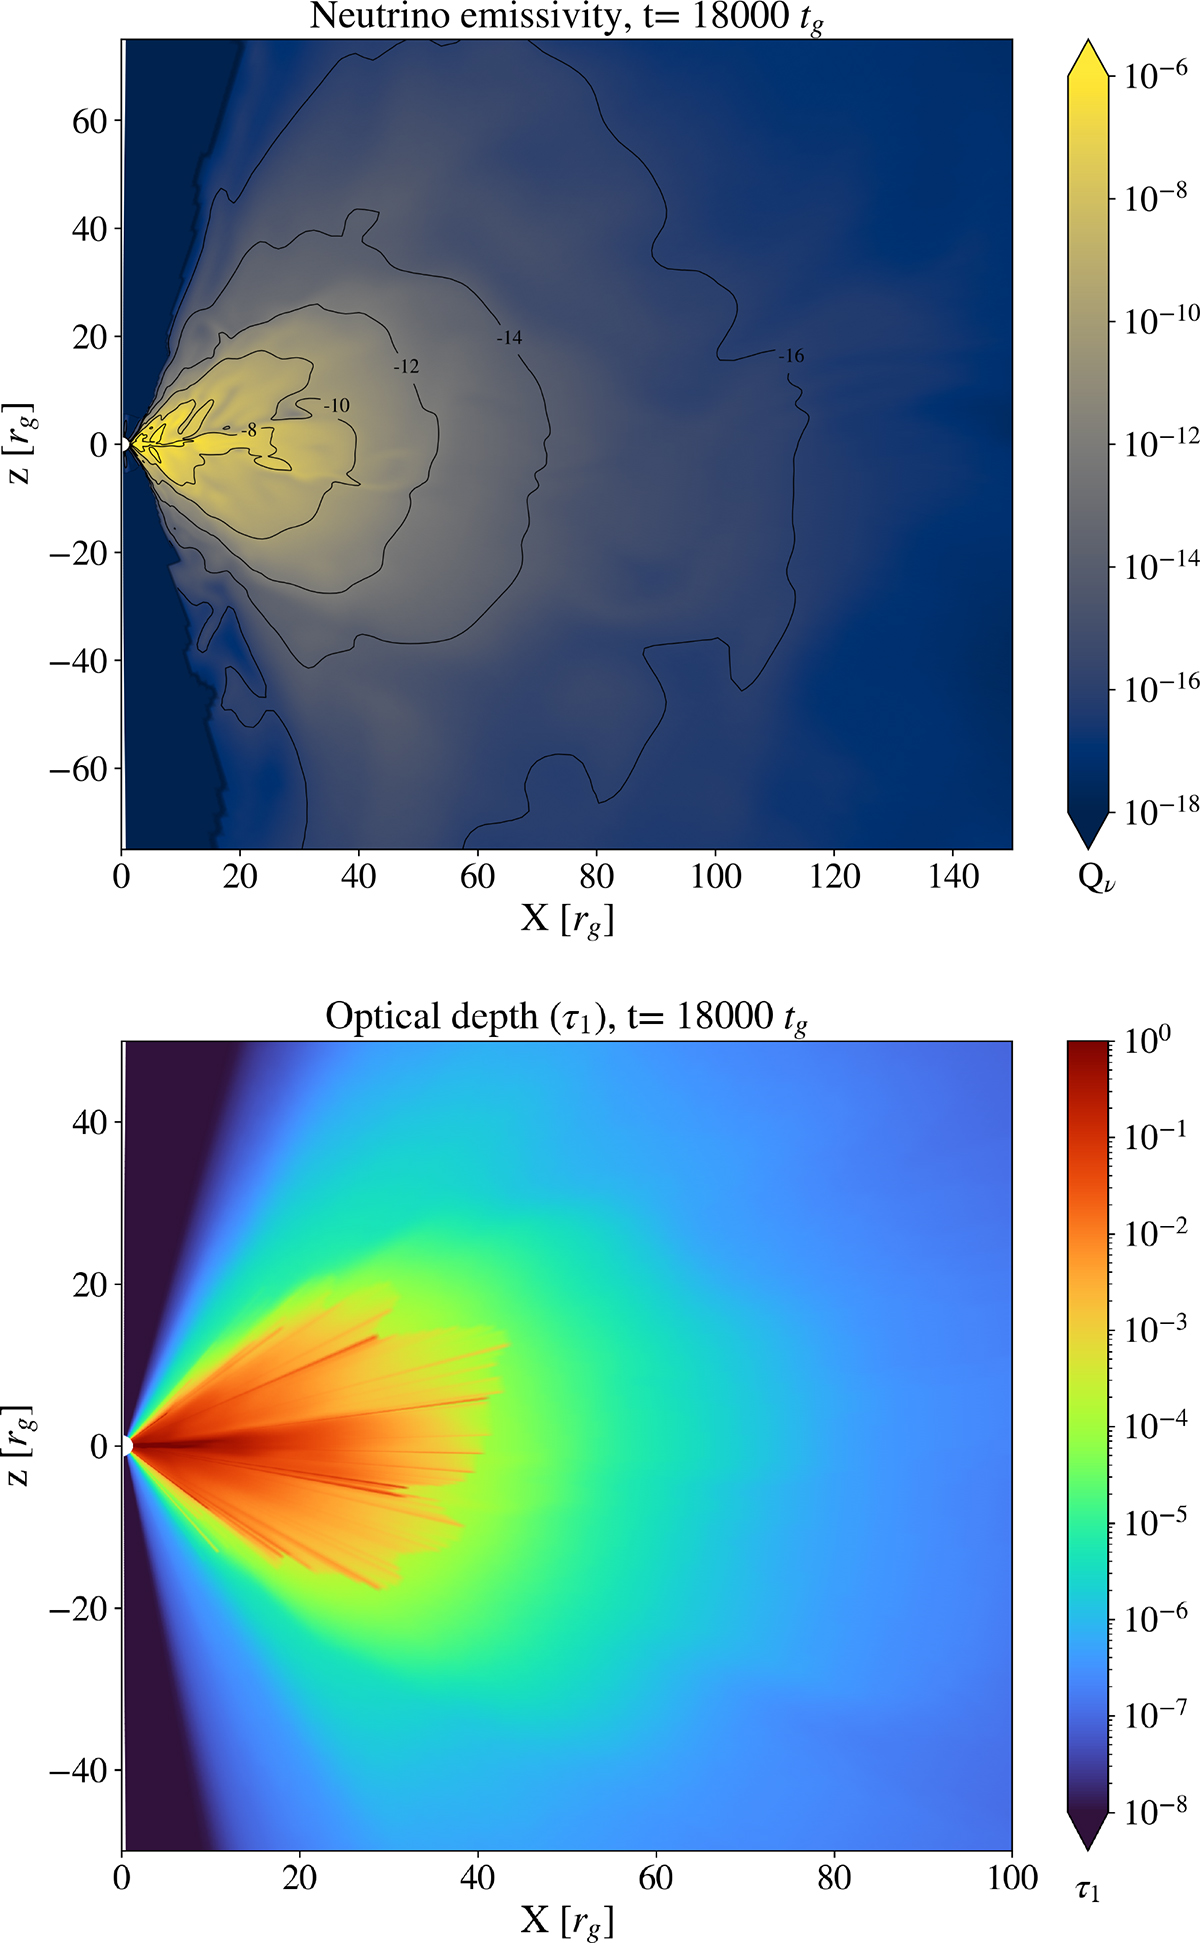
Snapshots from the 2D simulation of the SGRB central engine, as shown in Fig. 1. The top panel shows the neutrino cooling rate in the innermost region of the accretion disk. The bottom panel shows the color map of the neutrino optical depth.
Current usage metrics show cumulative count of Article Views (full-text article views including HTML views, PDF and ePub downloads, according to the available data) and Abstracts Views on Vision4Press platform.
Data correspond to usage on the plateform after 2015. The current usage metrics is available 48-96 hours after online publication and is updated daily on week days.
Initial download of the metrics may take a while.