Open Access
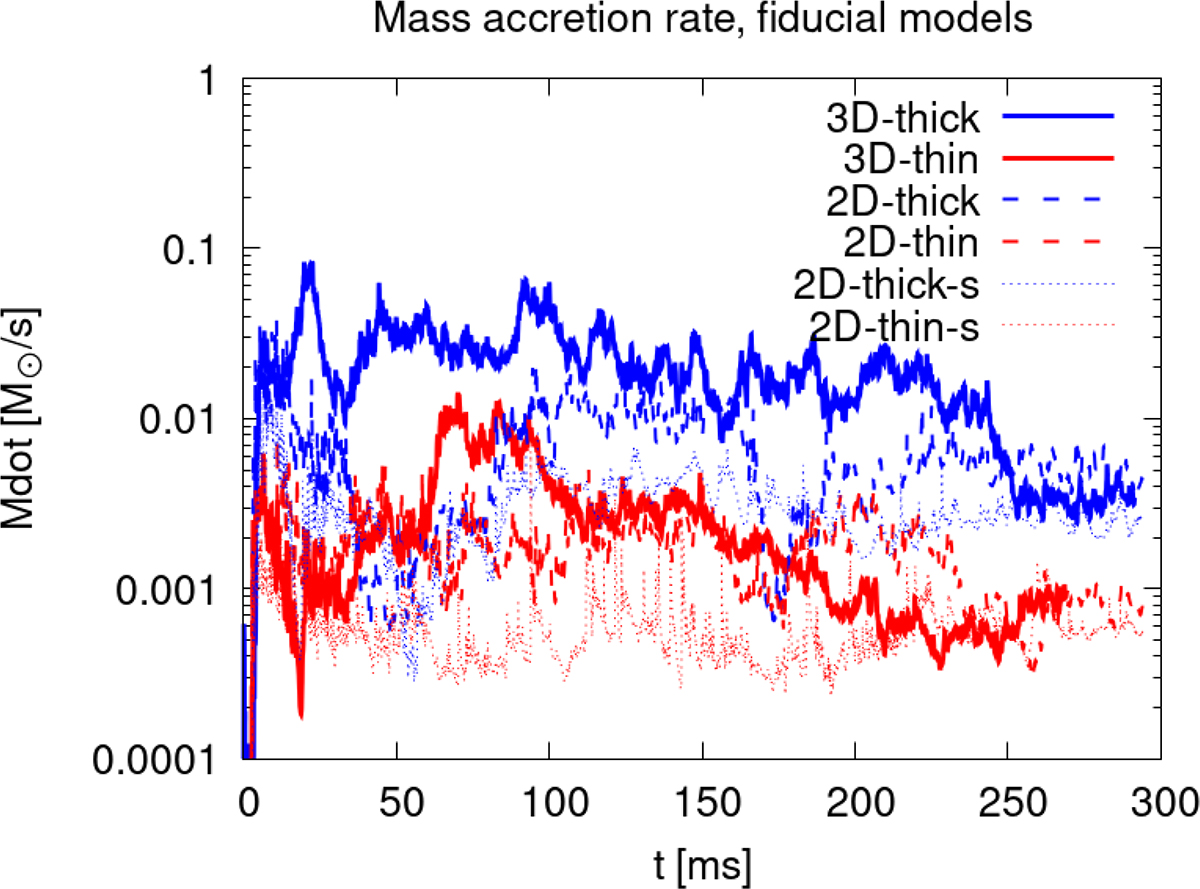
Fig. 4.
Download original image
Mass accretion rates for thin and thick models. The 2D-Thin-s, 2D-Thin and 3D-Thin models are shown with dotted, dashed, and solid red lines, respectively. The 2D-Thick-s, 2D-Thick and 3D-Thin models are shown with dotted, dashed, and solid blue lines, respectively. The plot is presented on a logarithmic scale.
Current usage metrics show cumulative count of Article Views (full-text article views including HTML views, PDF and ePub downloads, according to the available data) and Abstracts Views on Vision4Press platform.
Data correspond to usage on the plateform after 2015. The current usage metrics is available 48-96 hours after online publication and is updated daily on week days.
Initial download of the metrics may take a while.