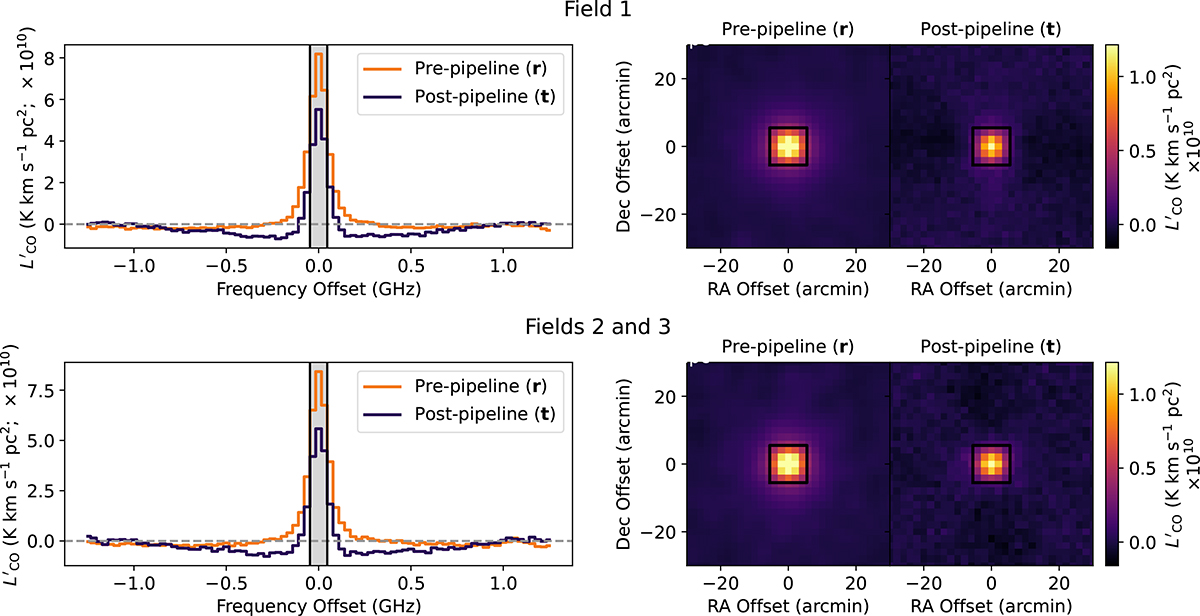
Fig. 5.
Download original image
Averaged simulated stacks used to account for pipeline signal loss in the stack, shown here for COMAP Field 1 above and Field 2 (which is also used for Field 3) below. We show the stacked spectra on the left (averaging across the central 5 × 5 spaxels for presentation purposes) and the stacked images (averaging across the central three spectral channels for presentation purposes) on the right. The apertures over which we sum are shown in black. The spatial and spectral effects of the COMAP analysis pipeline, and the different effects for each field, are visible.
Current usage metrics show cumulative count of Article Views (full-text article views including HTML views, PDF and ePub downloads, according to the available data) and Abstracts Views on Vision4Press platform.
Data correspond to usage on the plateform after 2015. The current usage metrics is available 48-96 hours after online publication and is updated daily on week days.
Initial download of the metrics may take a while.