Fig. 6.
Download original image
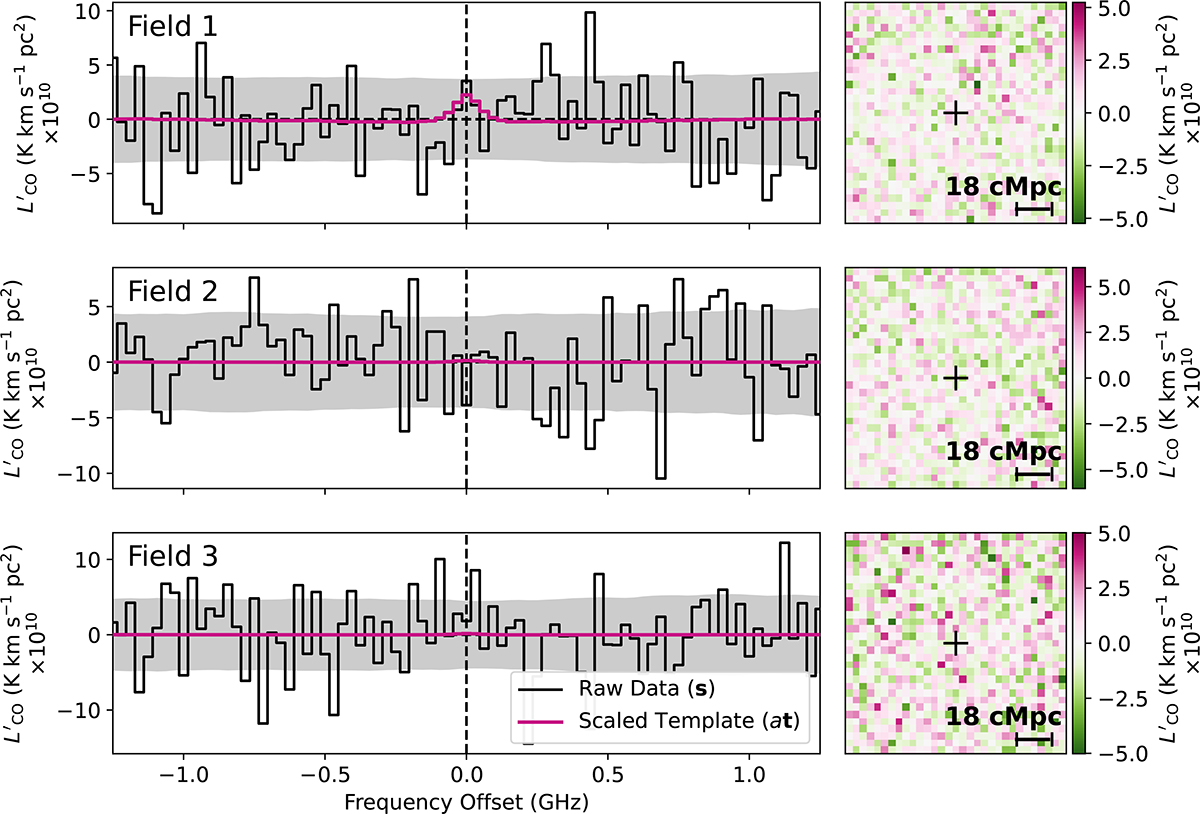
Stacked spectra (left) and 2D images (right) for COMAP data in each of the three COMAP fields at the positions of the eBOSS/DESI QSOs. The per channel RMS values are shown as grey shaded regions in the stacked spectrum, and the scaled template at is overlaid. The stack is not corrected for any pipeline signal-loss effects, and the templates have the same signal loss present.
Current usage metrics show cumulative count of Article Views (full-text article views including HTML views, PDF and ePub downloads, according to the available data) and Abstracts Views on Vision4Press platform.
Data correspond to usage on the plateform after 2015. The current usage metrics is available 48-96 hours after online publication and is updated daily on week days.
Initial download of the metrics may take a while.