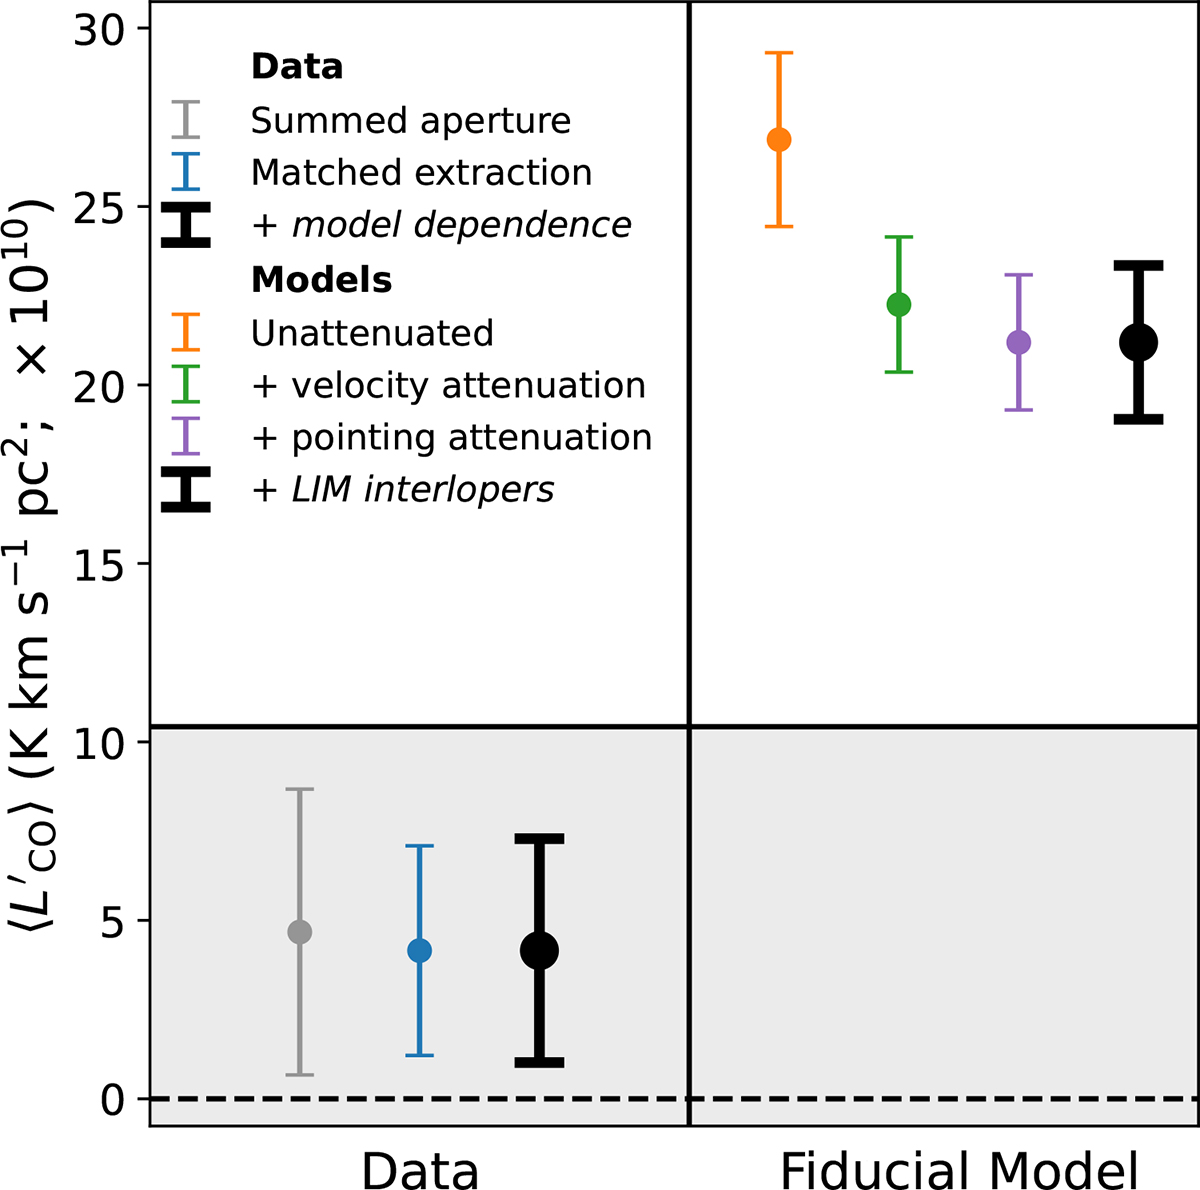
Fig. 9.
Download original image
Factors attenuating signal or increasing variance, shown for the upper limit from the COMAP-eBOSS/DESI stack and the fiducial model from C22. The corrections applied to the other models are qualitatively similar. The shaded region indicates the 2σ upper limit from the data alone. The various corrections are outlined in Sect. 6.
Current usage metrics show cumulative count of Article Views (full-text article views including HTML views, PDF and ePub downloads, according to the available data) and Abstracts Views on Vision4Press platform.
Data correspond to usage on the plateform after 2015. The current usage metrics is available 48-96 hours after online publication and is updated daily on week days.
Initial download of the metrics may take a while.