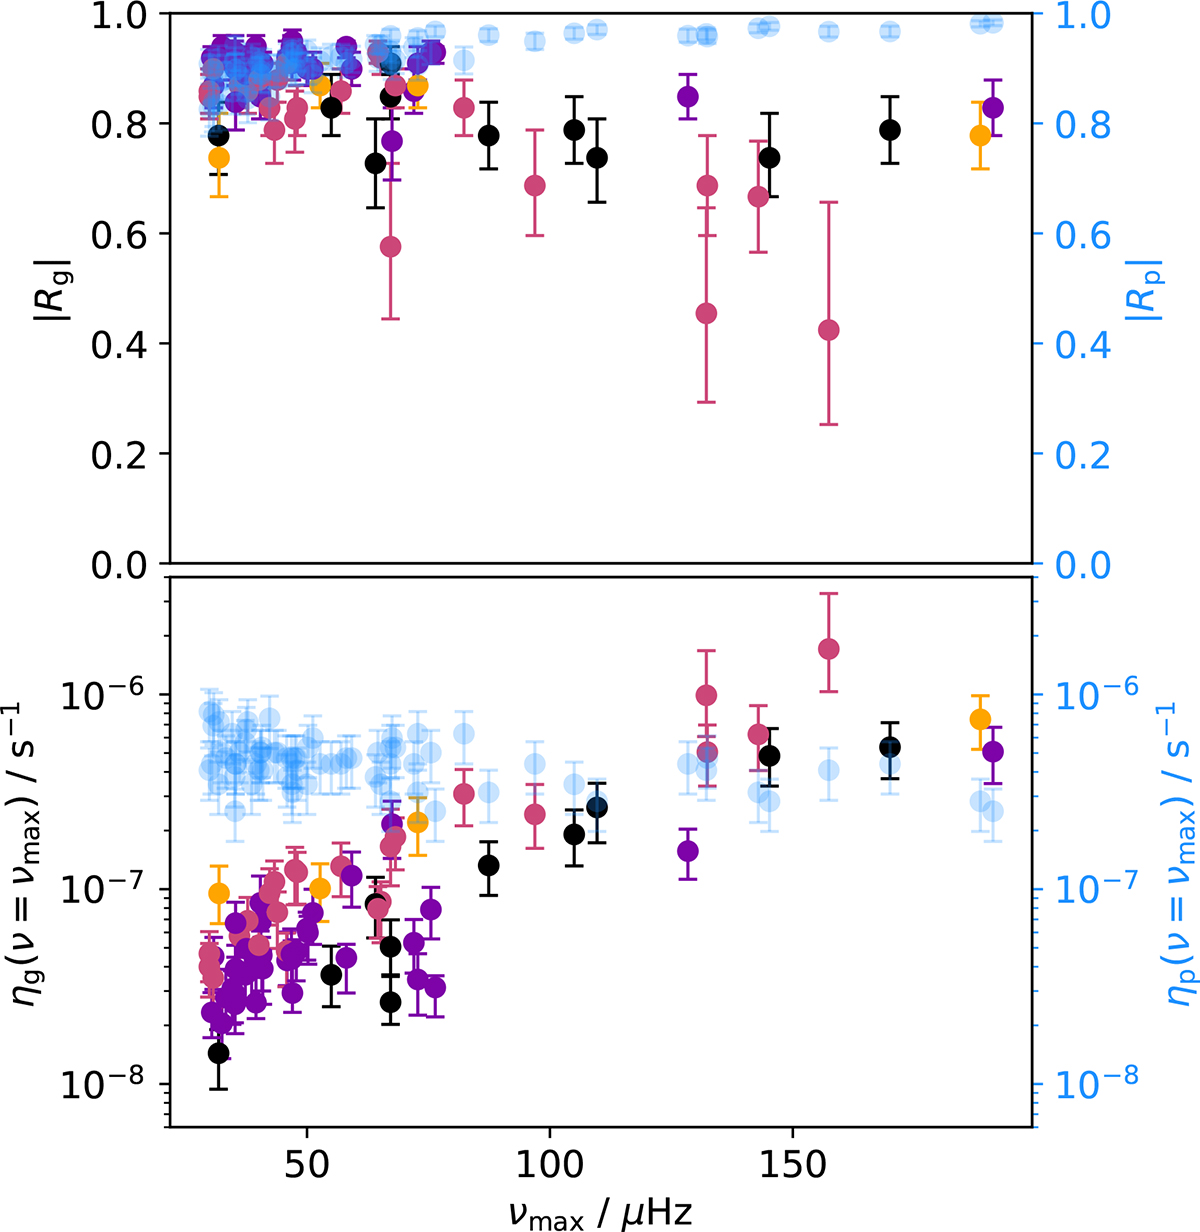
Fig. 10.
Download original image
Modulus of the reflection coefficient at the lower boundary of the g-mode cavity (upper panel) and damping rate in the g-mode cavity at the frequency νmax(lower panel) as a function of frequency of maximum oscillation power for the sample of red giants of Mosser et al. (2017). The same quantities are shown for the upper boundary of the p-mode cavity in transparent blue. The colors of the solid symbols correspond to the lower pie chart in Fig. 9 (i.e., to the detectability of the multiplet signature). Errors correspond to the uncertainties in the observed radial mode linewidth (see main text).
Current usage metrics show cumulative count of Article Views (full-text article views including HTML views, PDF and ePub downloads, according to the available data) and Abstracts Views on Vision4Press platform.
Data correspond to usage on the plateform after 2015. The current usage metrics is available 48-96 hours after online publication and is updated daily on week days.
Initial download of the metrics may take a while.