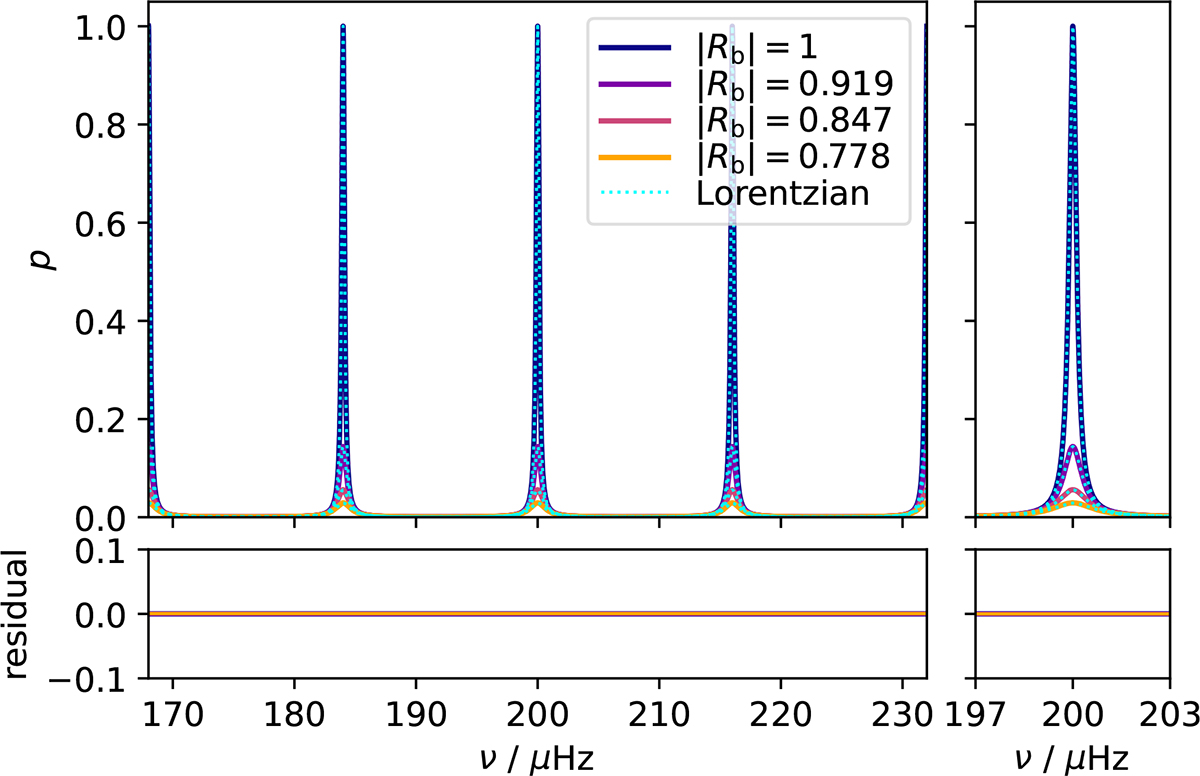
Fig. 3.
Download original image
Normalized power spectrum as a function of frequency for the set of stellar parameters A (see Table 1) with |Rt| = 0.95 for different values of |Rb| in a single-cavity system. Colored solid lines show p calculated using Eq. (43). Cyan dotted lines show the normalized power spectrum a sum of Lorentzians whose positions and widths were calculated using the resonance condition. The frequency resolution is selected so that all peaks are resolved. In the bottom row, we show the residual of each p and its corresponding sum of the Lorentzian functions.
Current usage metrics show cumulative count of Article Views (full-text article views including HTML views, PDF and ePub downloads, according to the available data) and Abstracts Views on Vision4Press platform.
Data correspond to usage on the plateform after 2015. The current usage metrics is available 48-96 hours after online publication and is updated daily on week days.
Initial download of the metrics may take a while.