Fig. 5.
Download original image
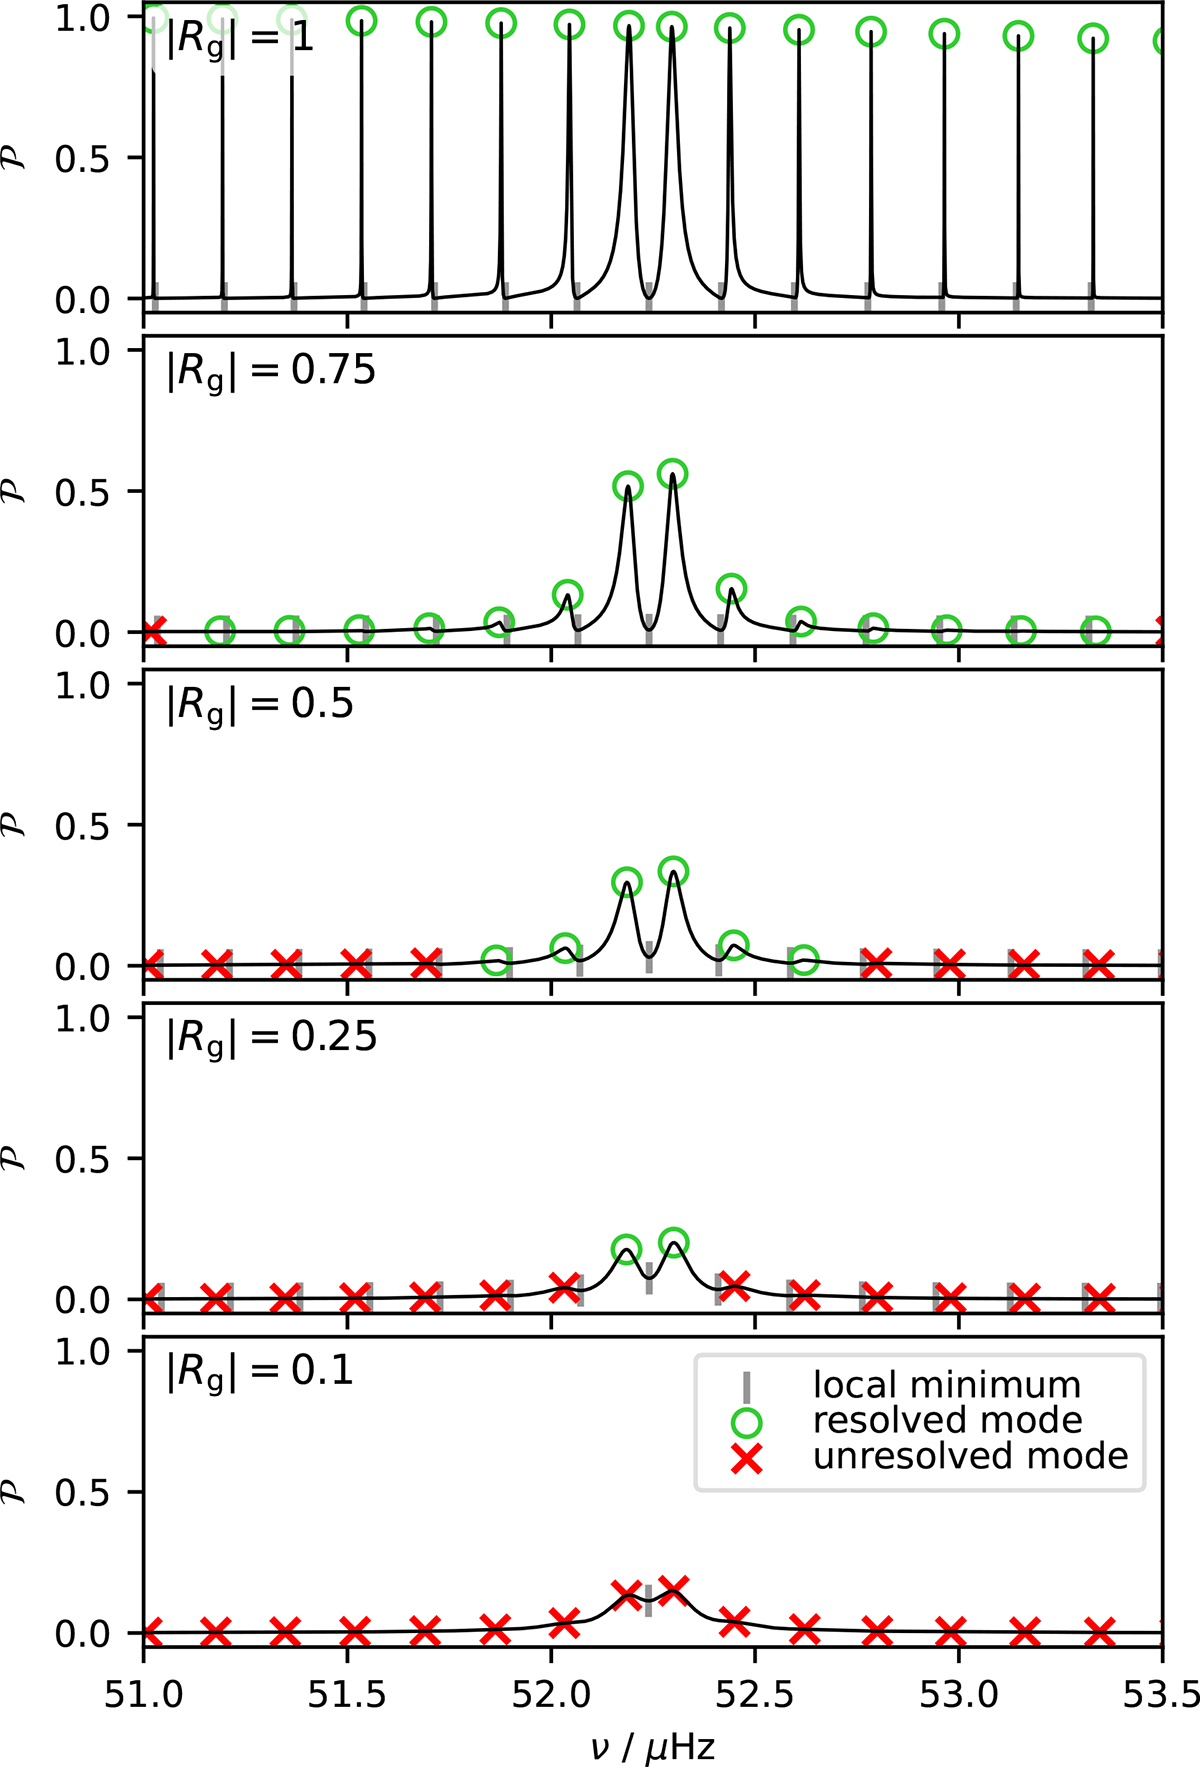
Relative power spectrum as a function of frequency for the set of stellar parameters B with |Rp| = 0.95 and different values of |Rg|. Gray vertical lines indicate the location of the local minima, green circles (red crosses) indicate the location of the resolved (unresolved) modes. The resolution criterion is described in Sect. 4.4. When the unresolved modes no longer corresponded to local maxima on the selected frequency grid, we used the resonance condition to determine their position.
Current usage metrics show cumulative count of Article Views (full-text article views including HTML views, PDF and ePub downloads, according to the available data) and Abstracts Views on Vision4Press platform.
Data correspond to usage on the plateform after 2015. The current usage metrics is available 48-96 hours after online publication and is updated daily on week days.
Initial download of the metrics may take a while.