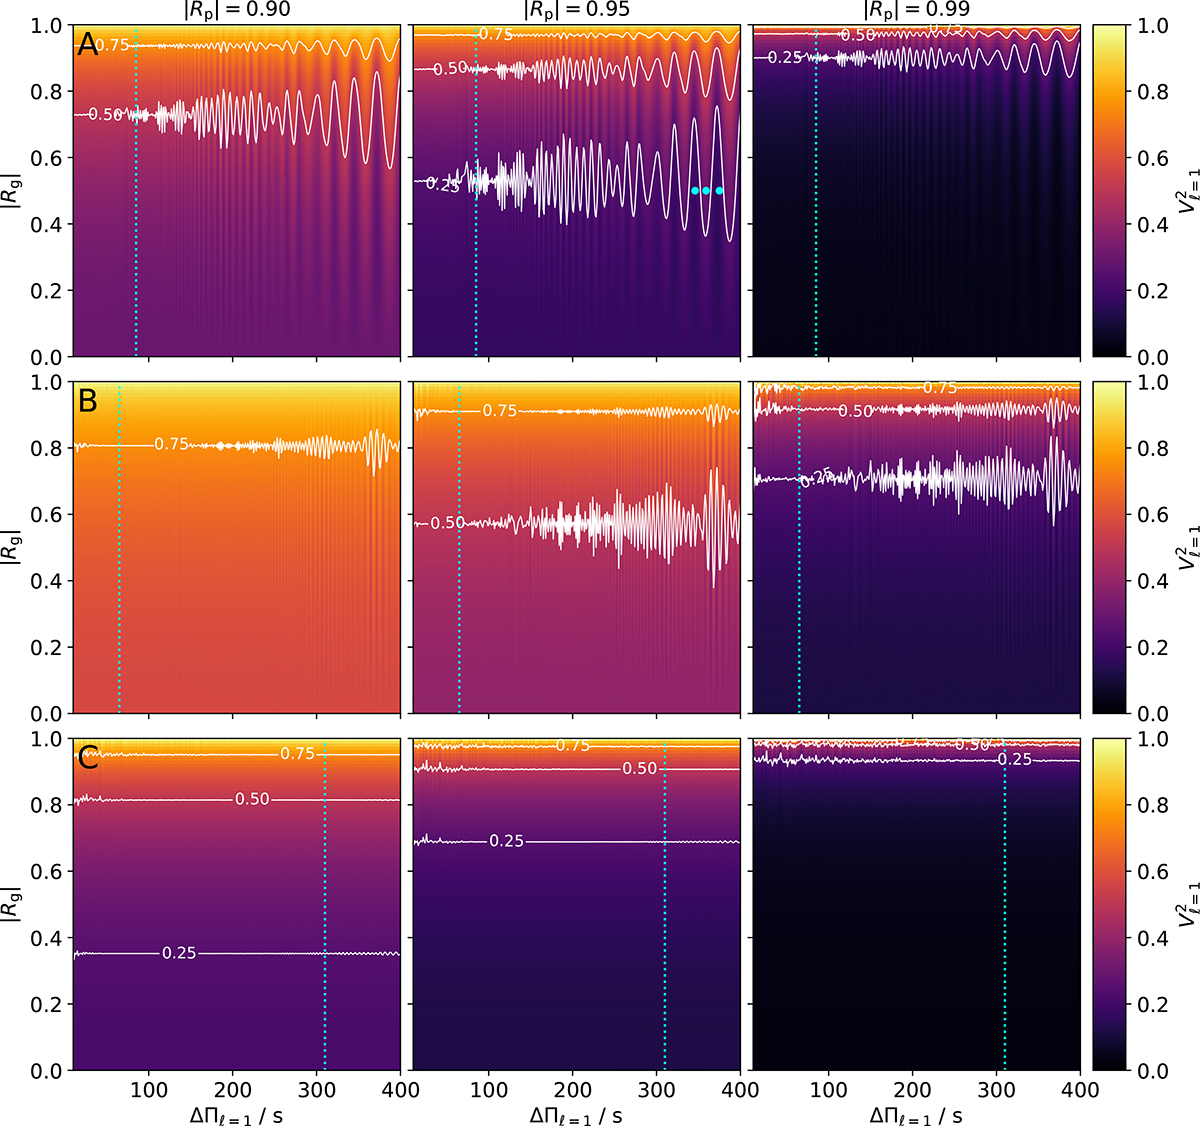
Fig. 6.
Download original image
Dipole mode visibility as a function of period spacing and the modulus of the reflection coefficient of the lower boundary of the g-mode cavity. Rows correspond to different sets of stellar parameters (see Table 1), columns correspond to different values of the reflection coefficient of the upper boundary of the p-mode cavity. White contour lines mark bands with equal visibility (see labels). Cyan dotted lines mark the nominal period spacing of the corresponding set of stellar parameters. Cyan dots indicate the parameter sets that are further examined in Fig. F.1.
Current usage metrics show cumulative count of Article Views (full-text article views including HTML views, PDF and ePub downloads, according to the available data) and Abstracts Views on Vision4Press platform.
Data correspond to usage on the plateform after 2015. The current usage metrics is available 48-96 hours after online publication and is updated daily on week days.
Initial download of the metrics may take a while.