Fig. 8.
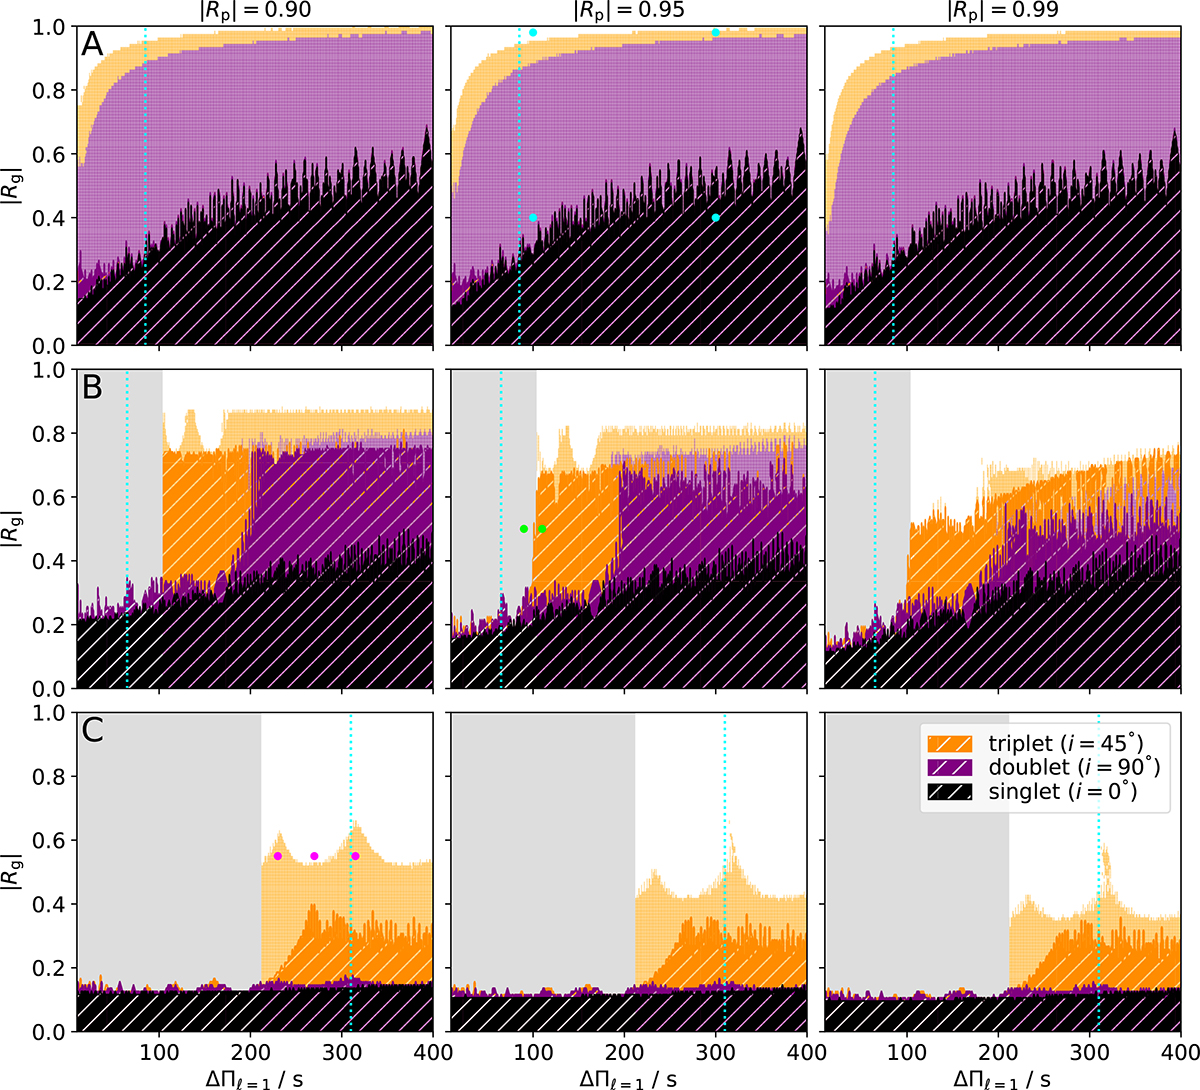
Download original image
Detectability of the dipole modes as a function of period spacing and the modulus of the reflection coefficient of the lower boundary of the g-mode cavity for a frequency shift of δν = 0.1 μHz. Rows correspond to different sets of stellar parameters, columns correspond to different values of the reflection coefficient of the upper boundary of the p-mode cavity. White areas indicate regions where both the mixed mode and multipole signatures can be detected for all tested inclination angles. Hatched areas indicate combinations for which mixed modes cannot be detected. Lightly colored areas indicate combinations of parameters for which the multiplet signature cannot be detected. Gray areas indicate regions where the average frequency separation of the mixed modes becomes comparable to δν. Other colors correspond to different inclination angles of the star. Black areas usually overlap with purple areas, and purple areas usually overlap with orange areas. Cyan dotted lines mark the nominal period spacing of the corresponding set of stellar parameters. Cyan dots indicate the sets of parameters that are further investigated in Fig. F.2, green dots mark the parameter sets shown in Fig. F.3, and magenta dots mark the sets shown in Fig. F.4.
Current usage metrics show cumulative count of Article Views (full-text article views including HTML views, PDF and ePub downloads, according to the available data) and Abstracts Views on Vision4Press platform.
Data correspond to usage on the plateform after 2015. The current usage metrics is available 48-96 hours after online publication and is updated daily on week days.
Initial download of the metrics may take a while.