Fig. 2.
Download original image
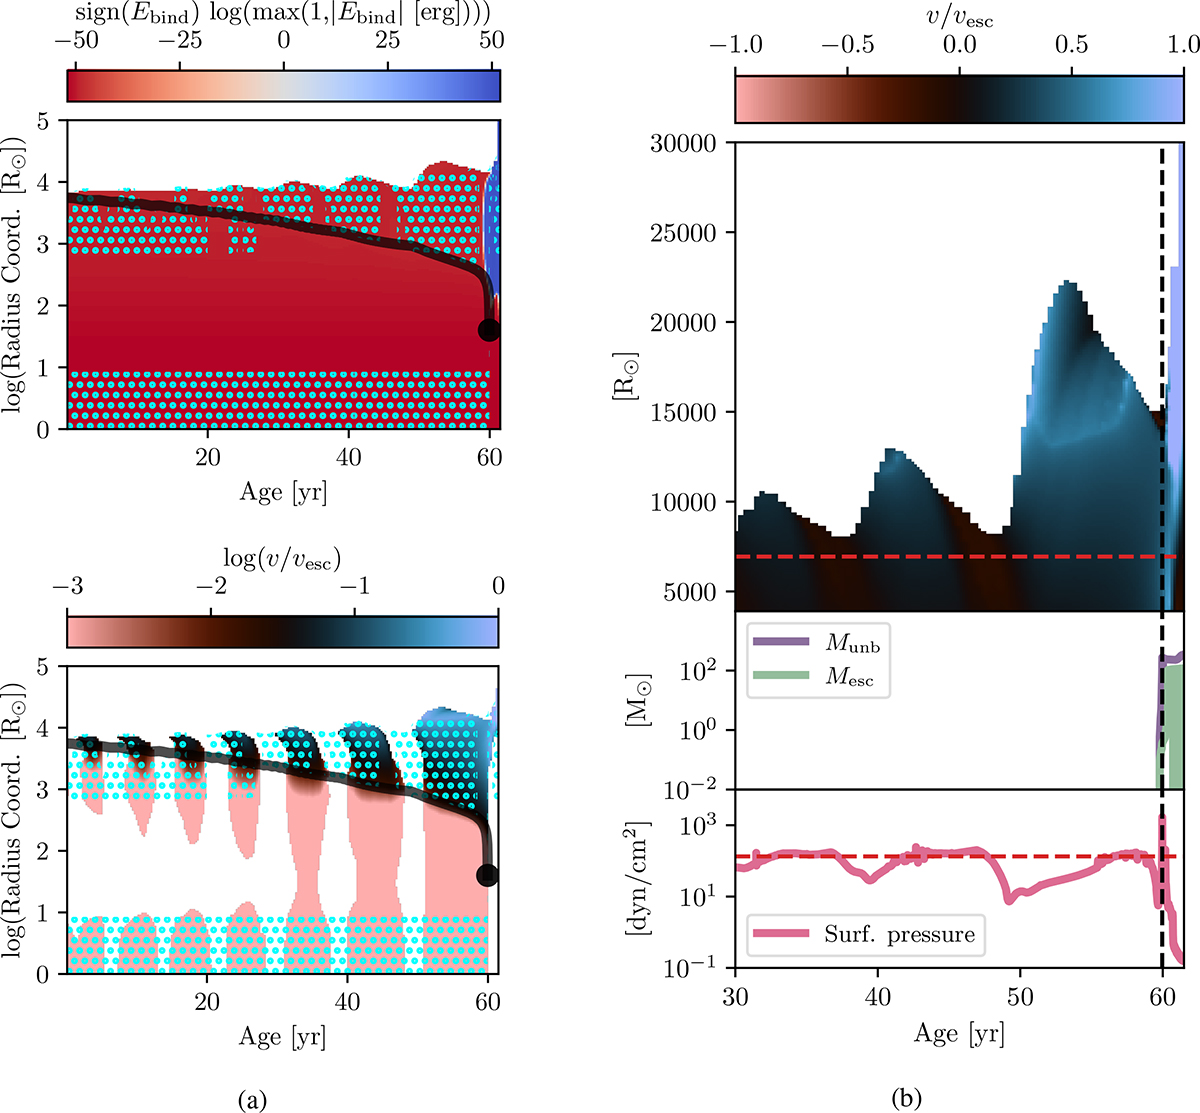
Inspiral evolution of a 1000 M⊙ EMS with a 70 M⊙ companion until the simulation crashes. Panel a: structural and dynamical evolution of the 1000 M⊙ EMS during inspiral with a 70 M⊙ companion. Top: EMS Kippenhahn diagram, in terms of the radius coordinate with respect to time, with the signed logarithm of the binding energy encoded by the background color; Bottom: Same but for log(v/vesc). In both panels dotted cyan regions marks convection zones. The solid black line represents the position of the companion, the black dot marks the merger event. Panel b: Zoom-in on the merger event. Top: EMS radius with v/vesc color map, the initial radius value is shown by the dashed red line; Middle: Unbound (Munb) and escaping (Mesc) masses. Bottom: Surface pressure, its initial value is shown by the dashed red line. In all three plots the time when the merger event is met is marked by the black vertical line.
Current usage metrics show cumulative count of Article Views (full-text article views including HTML views, PDF and ePub downloads, according to the available data) and Abstracts Views on Vision4Press platform.
Data correspond to usage on the plateform after 2015. The current usage metrics is available 48-96 hours after online publication and is updated daily on week days.
Initial download of the metrics may take a while.