Fig. 5.
Download original image
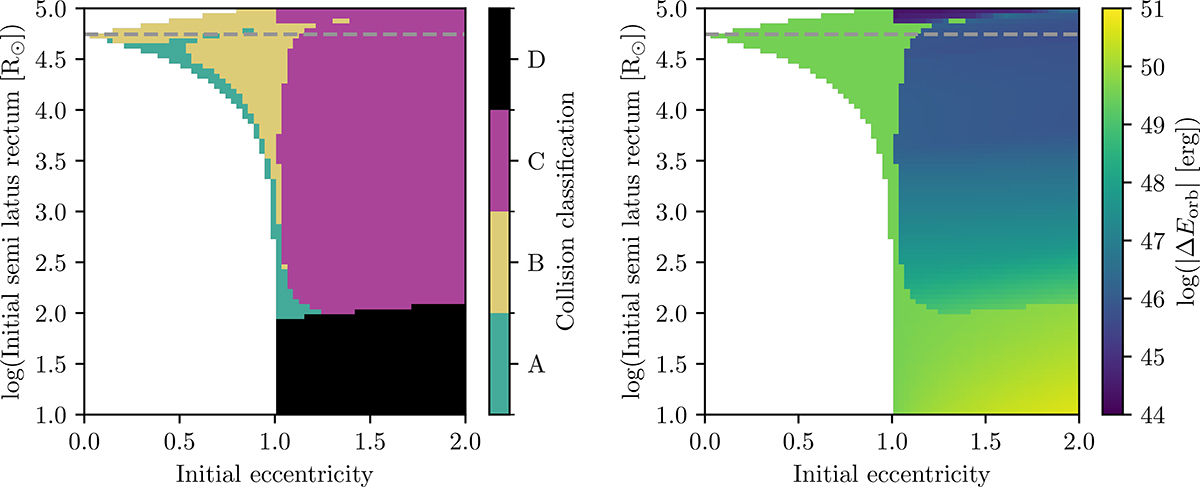
Same as Fig. 4, but using the EMS profile at the end of the hydrodynamic collision simulation for the interaction between a 1000 M⊙ EMS and a 70 M⊙ to determine the possible outcomes of a second collision. The EMS has expanded to a radius of ∼5 × 10⁴ R⊙, shown by the dashed gray line in both panels. Left plot: Collision outcome classification, right plot: Deposited orbital energy for the same configurations.
Current usage metrics show cumulative count of Article Views (full-text article views including HTML views, PDF and ePub downloads, according to the available data) and Abstracts Views on Vision4Press platform.
Data correspond to usage on the plateform after 2015. The current usage metrics is available 48-96 hours after online publication and is updated daily on week days.
Initial download of the metrics may take a while.