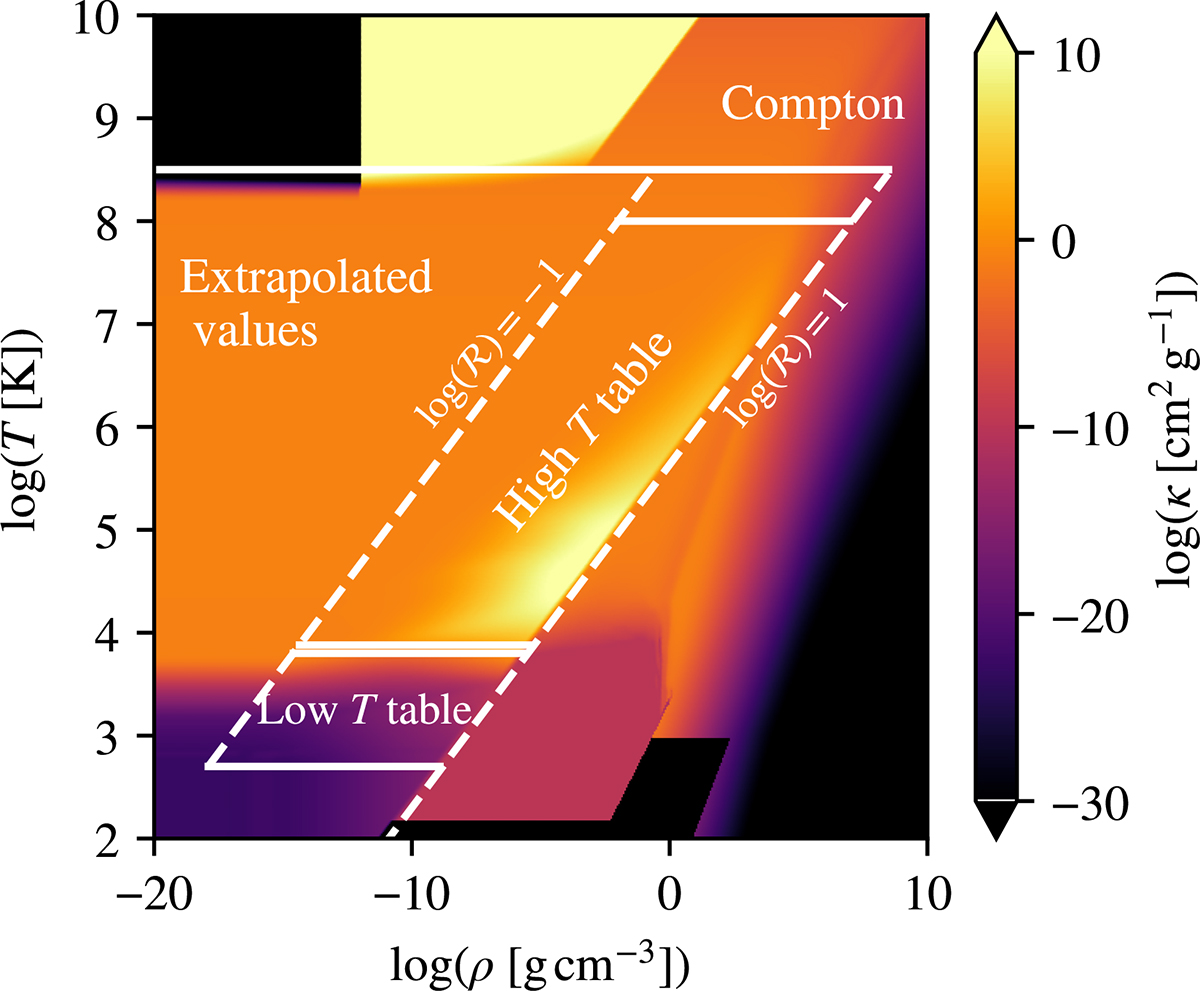
Fig. A.1.
Download original image
Values for the stellar opacities in the log(T) vs. log(ρ) plane for Z = 10−4. The color map denotes the value of the logarithm of the opacity in [cm2 g−1]. The limits for the domains of each opacity table/prescription are shown in white. The solid lines represent the boundaries in temperature, while the dashed lines represent the boundaries in ℛ values. The intermediate regions between the low T and high T tables, as wells as between the high T and the Compton opacities, are the blending zones between such domains. The low and high T tables are being extrapolated when ℛ < 10−1 or T < 500K by considering the nearest neighbor value in terms of the temperature and ℛ.
Current usage metrics show cumulative count of Article Views (full-text article views including HTML views, PDF and ePub downloads, according to the available data) and Abstracts Views on Vision4Press platform.
Data correspond to usage on the plateform after 2015. The current usage metrics is available 48-96 hours after online publication and is updated daily on week days.
Initial download of the metrics may take a while.