Fig. 1.
Download original image
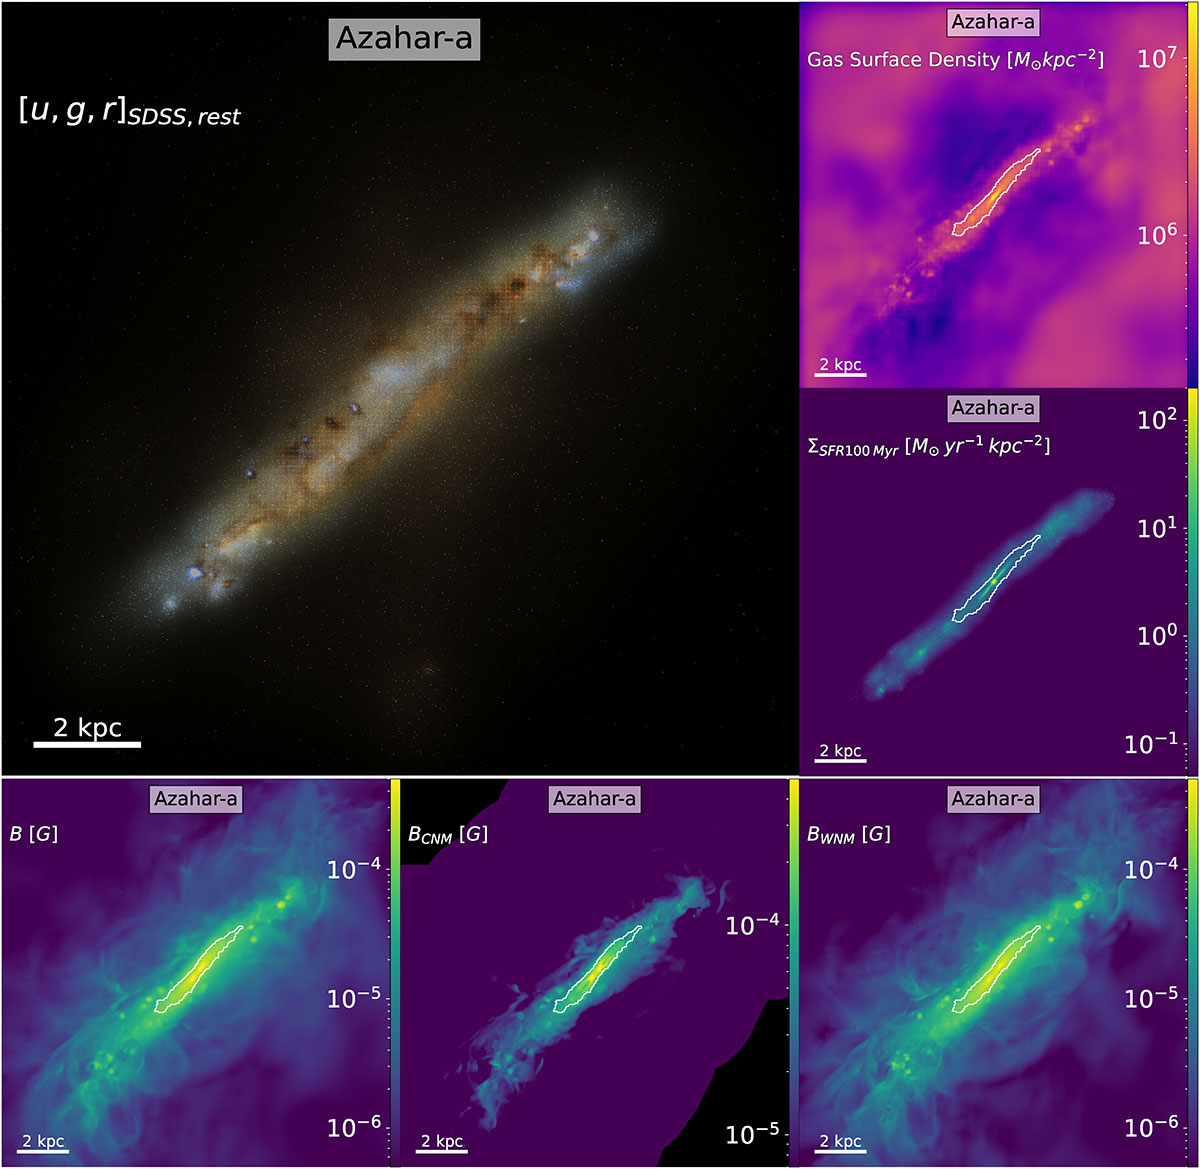
Multi-panel view of the simulated galaxy AZAHAR-A. The large left panel shows the rest-frame mock optical (SDSS ugr) image of the system. The two upper right panels display the gas surface density and the SFR surface density, averaged over the past 100 Myr. The three bottom panels show the total magnetic field strength for the full gas, CNM, and WNM components. White contours in all panels mark the disc region adopted for the analysis.
Current usage metrics show cumulative count of Article Views (full-text article views including HTML views, PDF and ePub downloads, according to the available data) and Abstracts Views on Vision4Press platform.
Data correspond to usage on the plateform after 2015. The current usage metrics is available 48-96 hours after online publication and is updated daily on week days.
Initial download of the metrics may take a while.