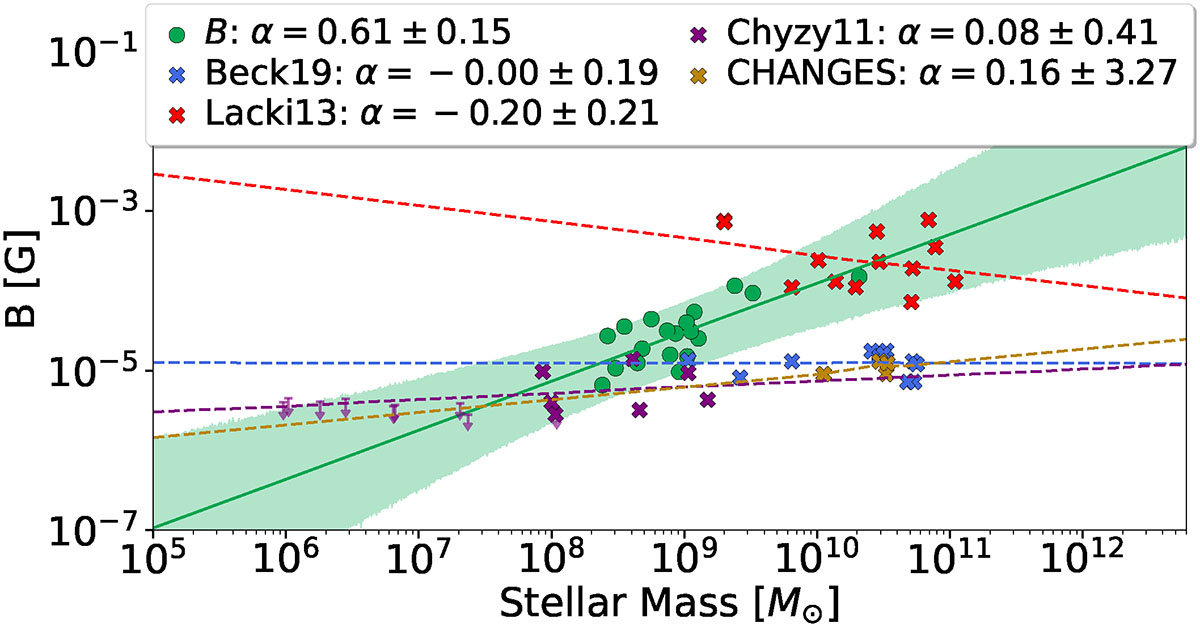
Fig. 3.
Download original image
Magnetic field strength as a function of stellar mass, M★ (solid green circles). The solid green line shows the best fit, and the shaded region indicates the 95% prediction interval, with the fitted slopes and the standard error reported in the legend. Samples of observed galaxies taken from the literature and their best-fit relations (dashed lines) are overlaid with different colour crosses: red (Lacki & Beck 2013), black (Lopez-Rodriguez 2023), purple (Chyży et al. 2011), navy blue (Beck et al. 2019), and goldenrod (Stein et al. 2019; Mora-Partiarroyo et al. 2019; Stein et al. 2020; Heald et al. 2022, CHANGES survey). Their respective best-fit relations are shown as dashed lines. Upper limits from Chyży et al. (2011) are shown as downward arrows, and are excluded from the fits.
Current usage metrics show cumulative count of Article Views (full-text article views including HTML views, PDF and ePub downloads, according to the available data) and Abstracts Views on Vision4Press platform.
Data correspond to usage on the plateform after 2015. The current usage metrics is available 48-96 hours after online publication and is updated daily on week days.
Initial download of the metrics may take a while.