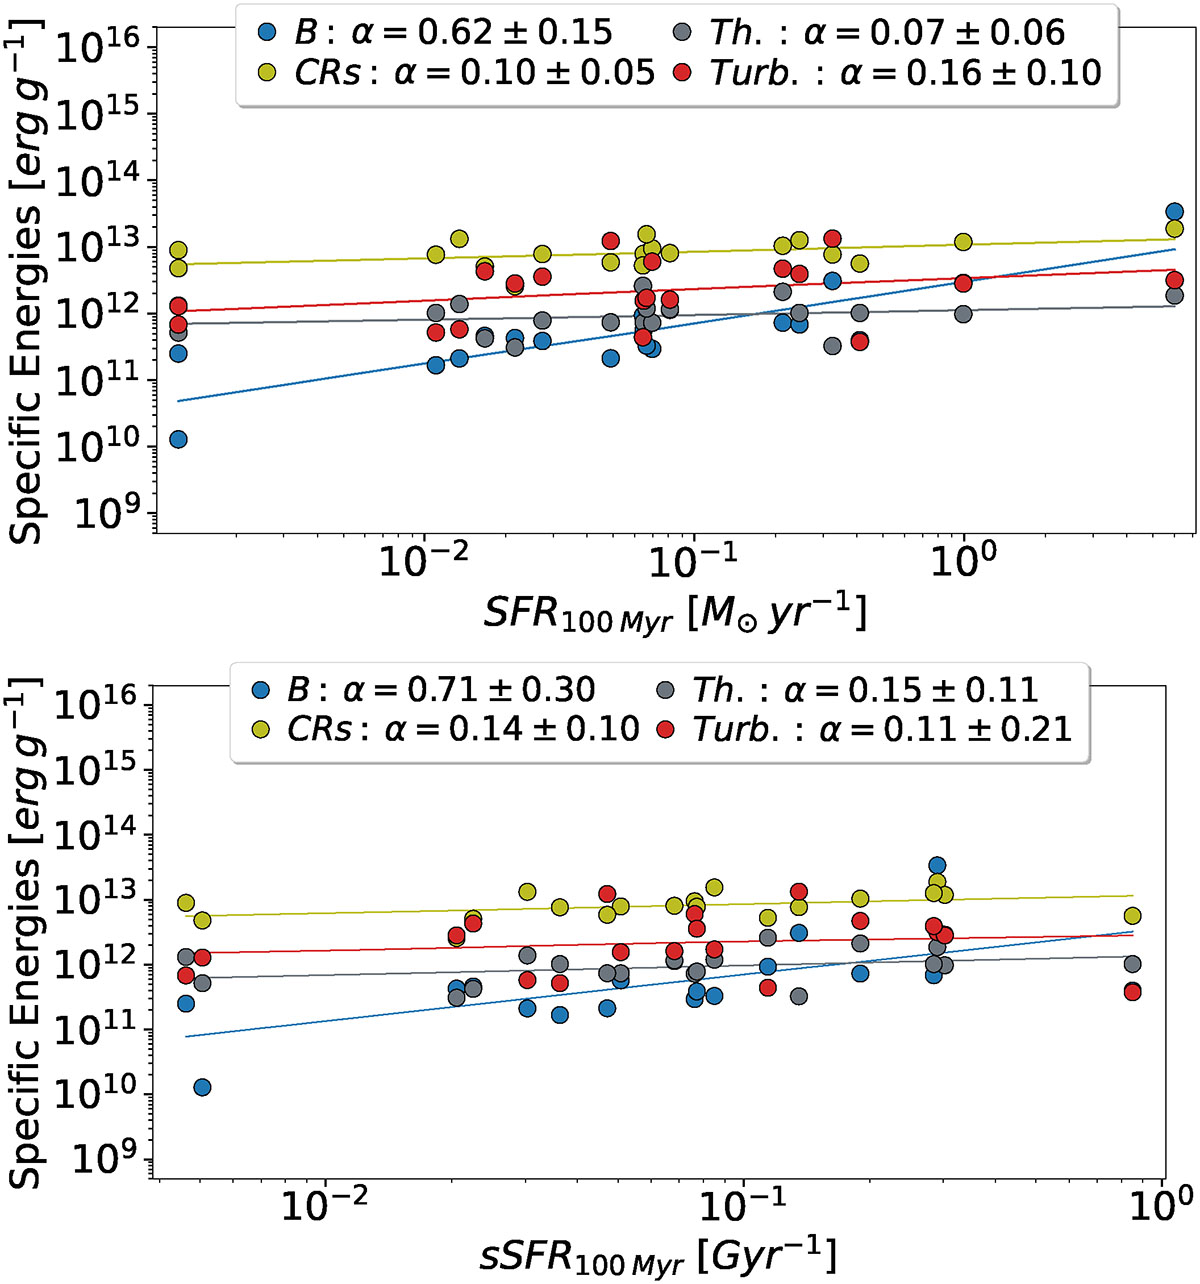
Fig. 4.
Download original image
Specific energies as a function of the SFR (top panel) and sSFR (bottom panel). Each point represents the specific energy associated with the magnetic (blue), thermal (grey), turbulent (red), and CR (yellow) component within the disc of each galaxy. The best fits for each energy component are shown as coloured lines, with their corresponding slopes and standard errors provided in the legends.
Current usage metrics show cumulative count of Article Views (full-text article views including HTML views, PDF and ePub downloads, according to the available data) and Abstracts Views on Vision4Press platform.
Data correspond to usage on the plateform after 2015. The current usage metrics is available 48-96 hours after online publication and is updated daily on week days.
Initial download of the metrics may take a while.