Fig. 5.
Download original image
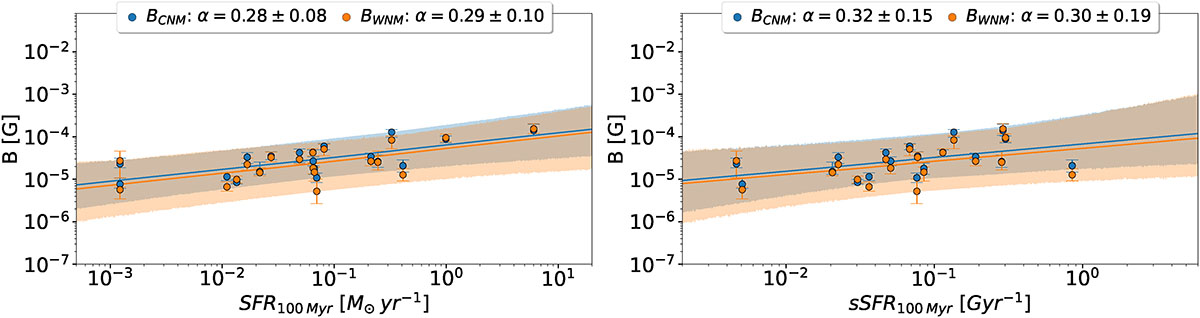
Magnetic field strength versus global star formation for neutral ISM phases. Panels show the median magnetic field strength, B, within the disc mask of the simulated sample (solid circles) in the CNM (blue) and WNM (orange) phases. Error bars for each data point show the IQR for each galaxy. Solid lines indicate best-fit power laws, and the shaded region indicates the 95% prediction interval; fitted slopes are reported in the legends. Left: B versus integrated SFR. Right: B versus specific SFR (sSFR).
Current usage metrics show cumulative count of Article Views (full-text article views including HTML views, PDF and ePub downloads, according to the available data) and Abstracts Views on Vision4Press platform.
Data correspond to usage on the plateform after 2015. The current usage metrics is available 48-96 hours after online publication and is updated daily on week days.
Initial download of the metrics may take a while.