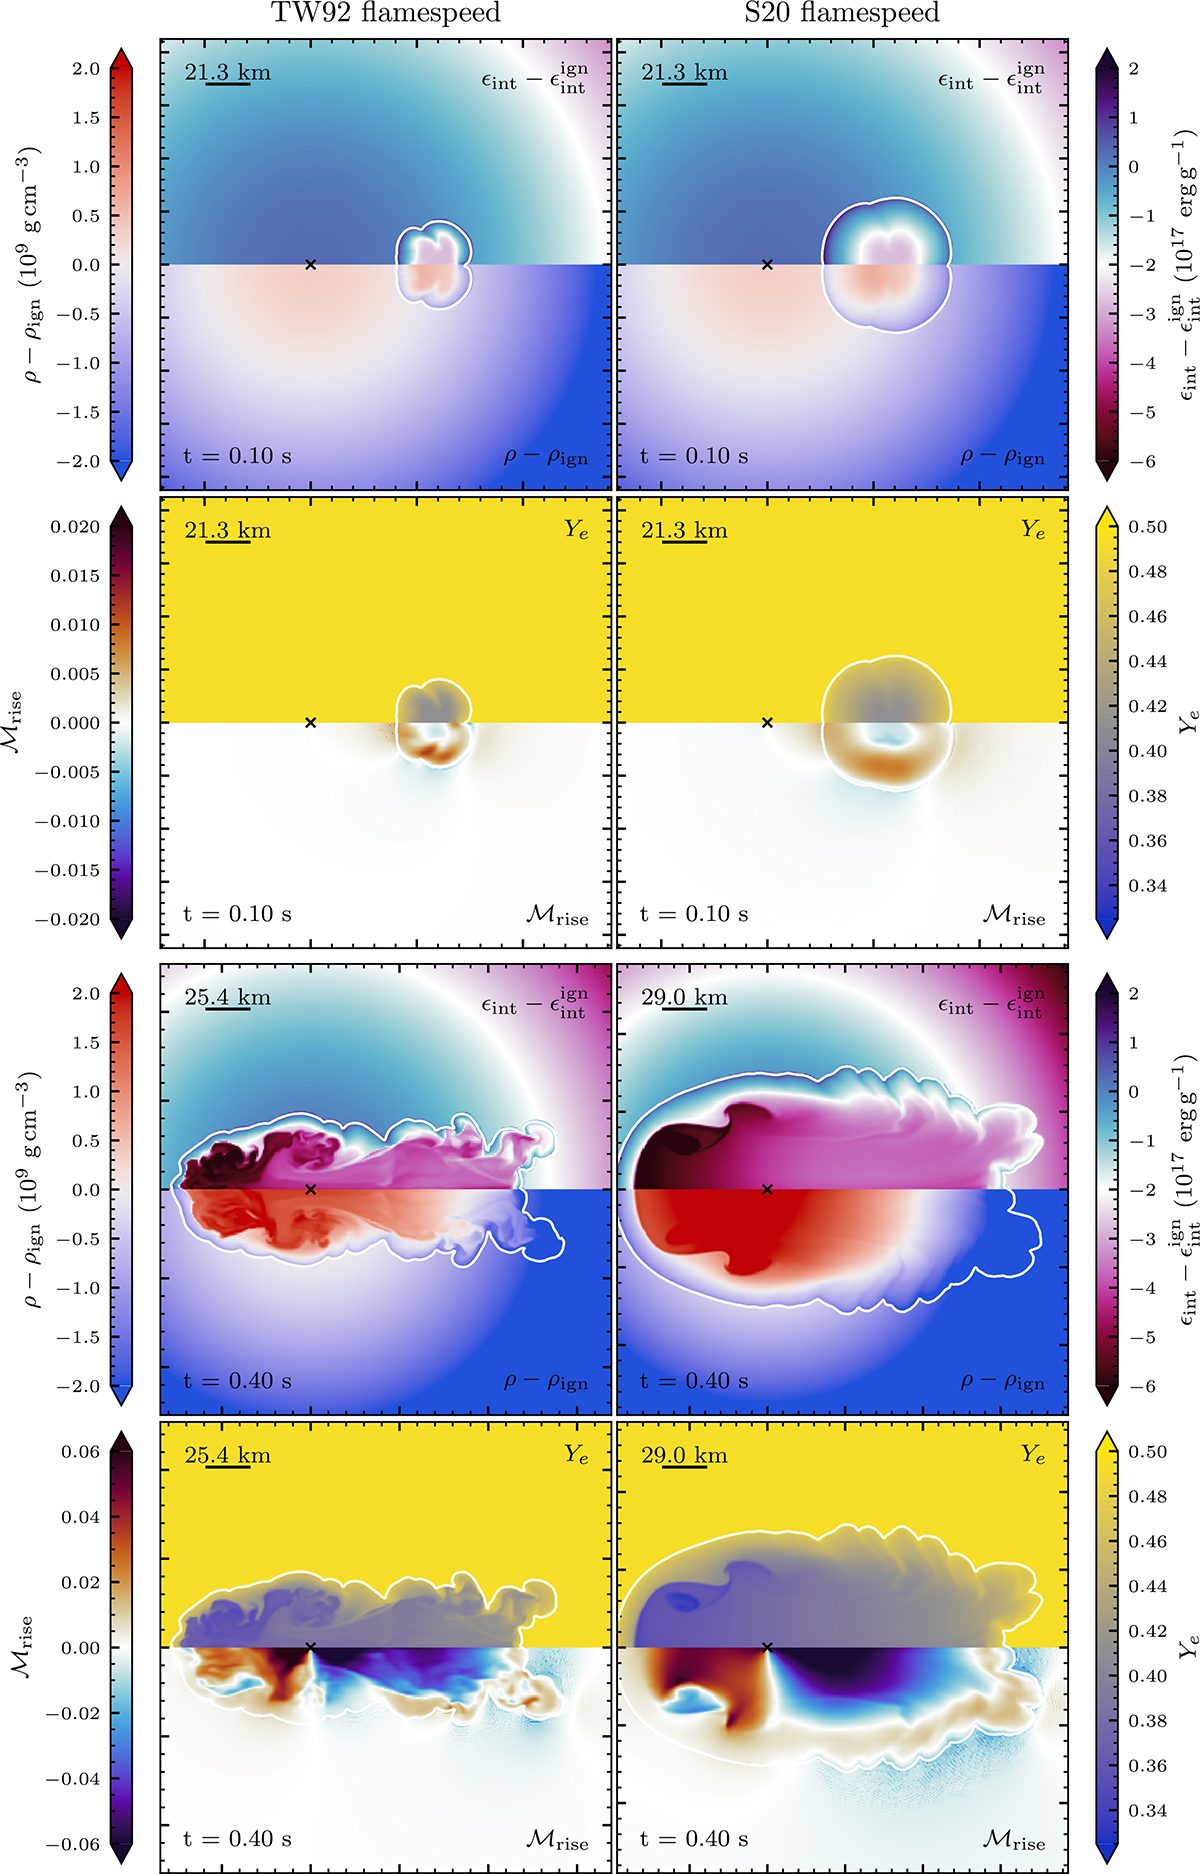
Fig. 2.
Download original image
Visualization of the impact of different laminar flame speed parameterizations on the example of the rho10.093130625_r50(_sfs) model. The left column shows the simulation with the TW92 flame speeds, the right column the one with the S20 values. The top two rows show the simulation a t = 0.1 s, the bottom two at t = 0.4 s. Here, we show four different quantities: the density and internal energy with respect to their values at the ignition location (at t = 0.0 s), the mach number of the flow in the radial direction ℳrise, and the electron fraction Ye. Note the different ranges of the ℳrise color bars.
Current usage metrics show cumulative count of Article Views (full-text article views including HTML views, PDF and ePub downloads, according to the available data) and Abstracts Views on Vision4Press platform.
Data correspond to usage on the plateform after 2015. The current usage metrics is available 48-96 hours after online publication and is updated daily on week days.
Initial download of the metrics may take a while.