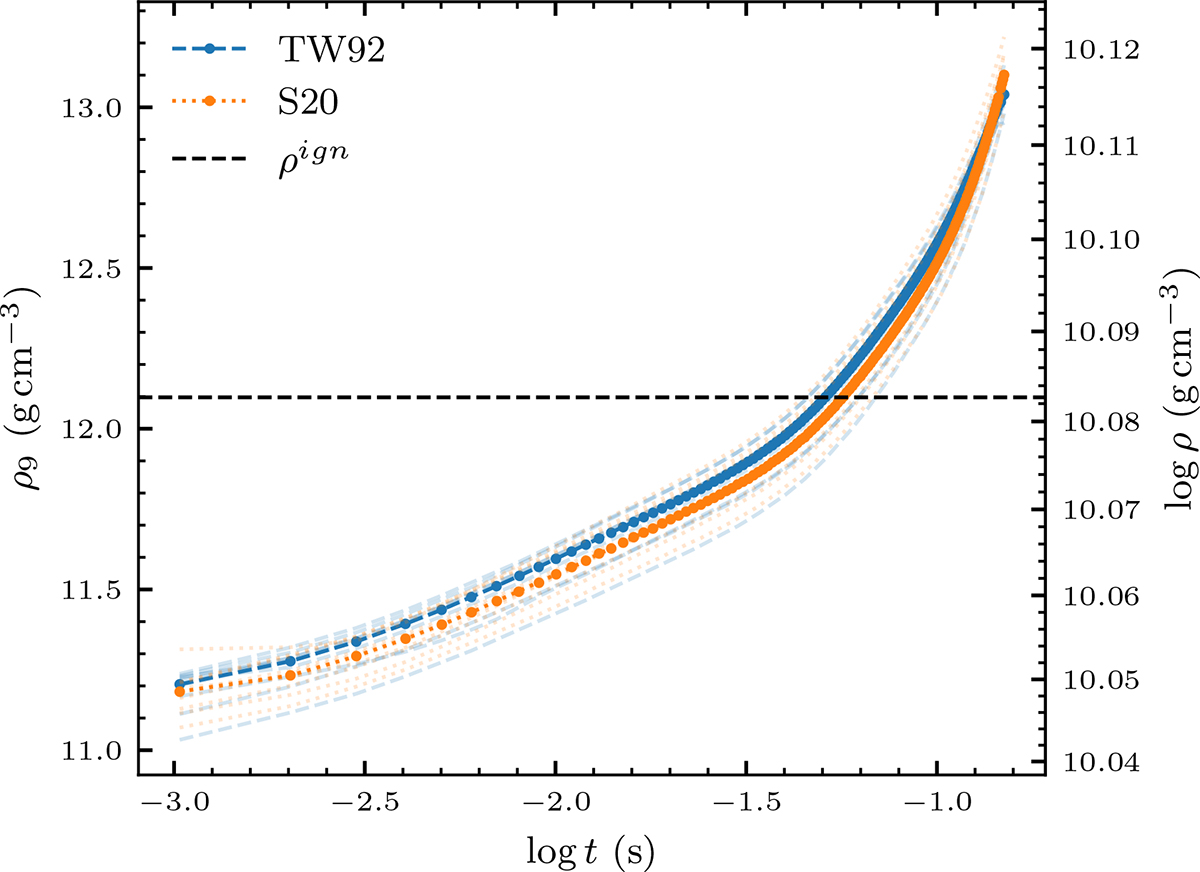
Fig. 5.
Download original image
Illustration of the density inversion of the rho10.094140625_r50 model for the TW92 and S20 flame speed parametrization. Here, we show the density trajectories of tracer particles that are located inside the ignition bubble at t = 0.0 s. The transparent lines are the individual trajectories, whereas the opaque lines are the mean density of all trajectories.
Current usage metrics show cumulative count of Article Views (full-text article views including HTML views, PDF and ePub downloads, according to the available data) and Abstracts Views on Vision4Press platform.
Data correspond to usage on the plateform after 2015. The current usage metrics is available 48-96 hours after online publication and is updated daily on week days.
Initial download of the metrics may take a while.