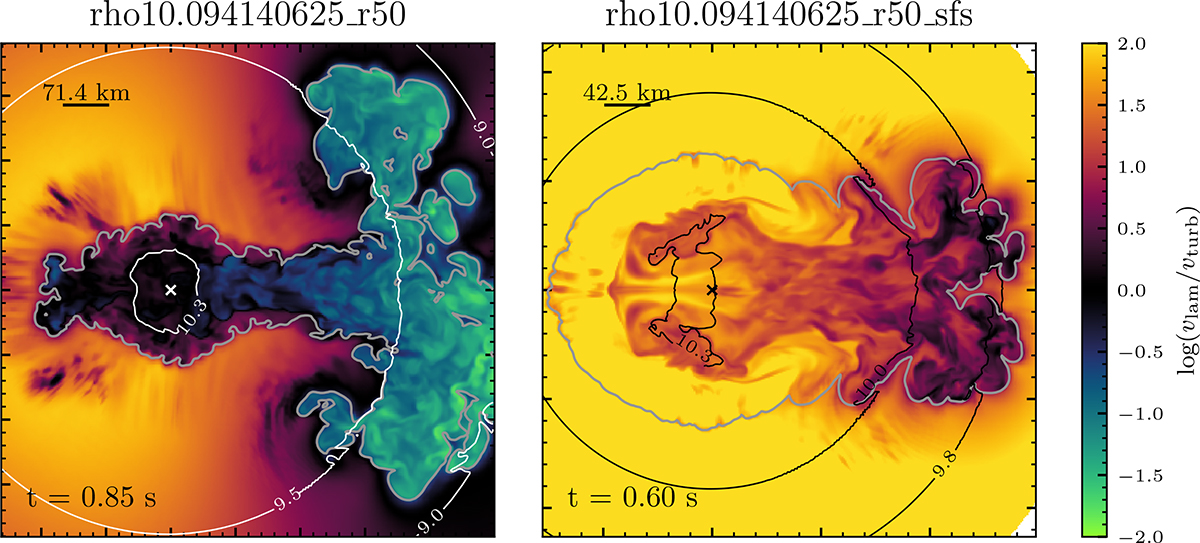
Fig. 6.
Download original image
Illustration of the ratio between vlam and vturb. We show the TW92 (left) and S20 (right) variants of the rho10.094140625_r50 model at the point in time where their MCh, eff drops below the initial WD mass. The gray contour indicates the levelset, whereas the white and black contours indicate surfaces of equal log ρ. We note that although we show vlam/vturb on the whole grid, it is only relevant at the flame surface; we only show it everywhere else for illustration purposes.
Current usage metrics show cumulative count of Article Views (full-text article views including HTML views, PDF and ePub downloads, according to the available data) and Abstracts Views on Vision4Press platform.
Data correspond to usage on the plateform after 2015. The current usage metrics is available 48-96 hours after online publication and is updated daily on week days.
Initial download of the metrics may take a while.