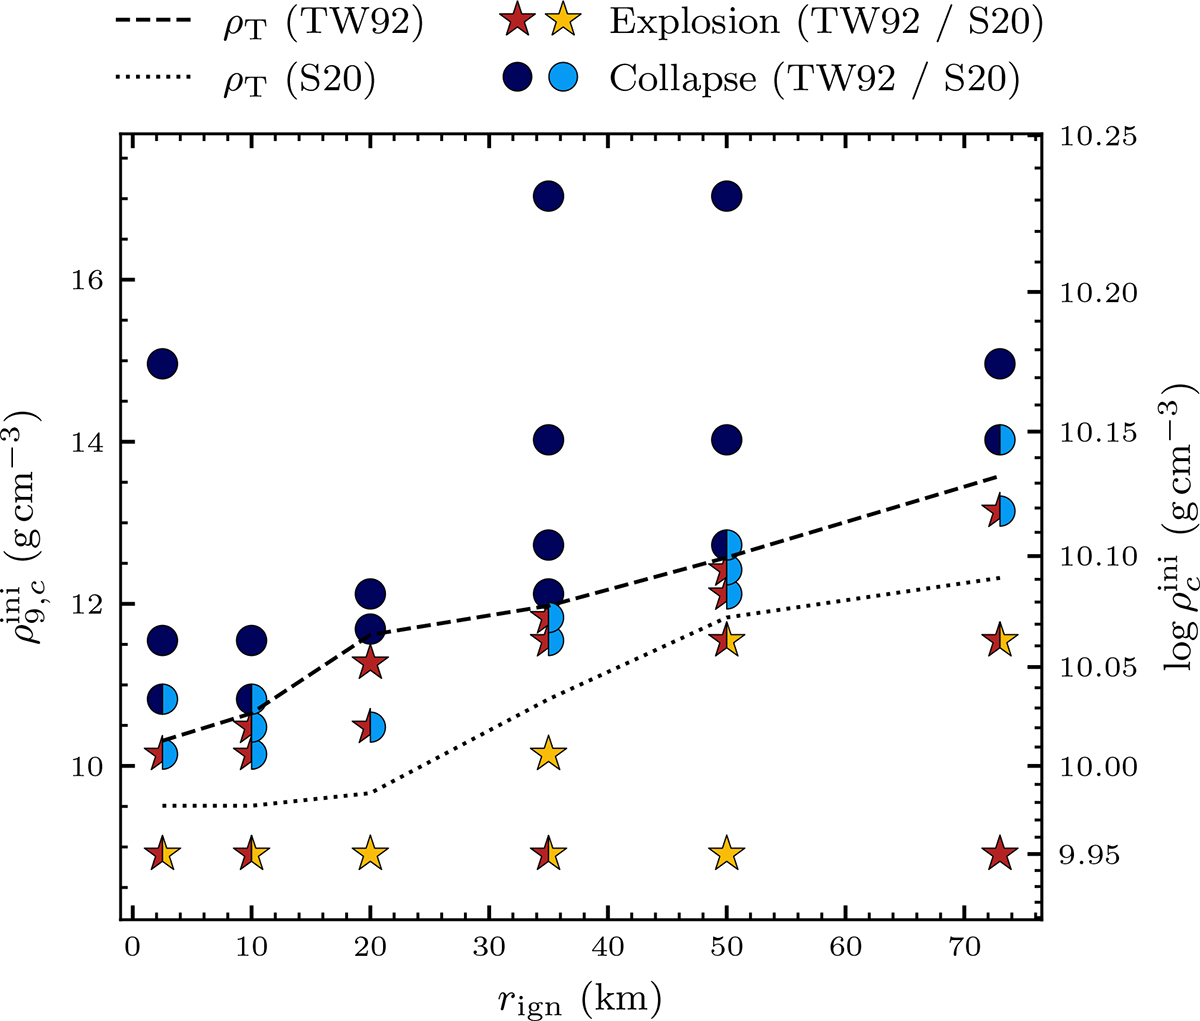
Fig. 8.
Download original image
Outcomes of all simulations in our parameter study dependent on ignition location and central density at ignition. Here the dashed and dotted lines indicate the transition from explosion to collapse for the TW92 and S20 flame speeds, respectively. These lines are only serve as a guide for the eye as they only show the midpoint between the last exploding and first collapsing simulation. We note that this figure does not include simulations with log ρcini = 10.4 for better visibility.
Current usage metrics show cumulative count of Article Views (full-text article views including HTML views, PDF and ePub downloads, according to the available data) and Abstracts Views on Vision4Press platform.
Data correspond to usage on the plateform after 2015. The current usage metrics is available 48-96 hours after online publication and is updated daily on week days.
Initial download of the metrics may take a while.