Open Access
Fig. 1
Download original image
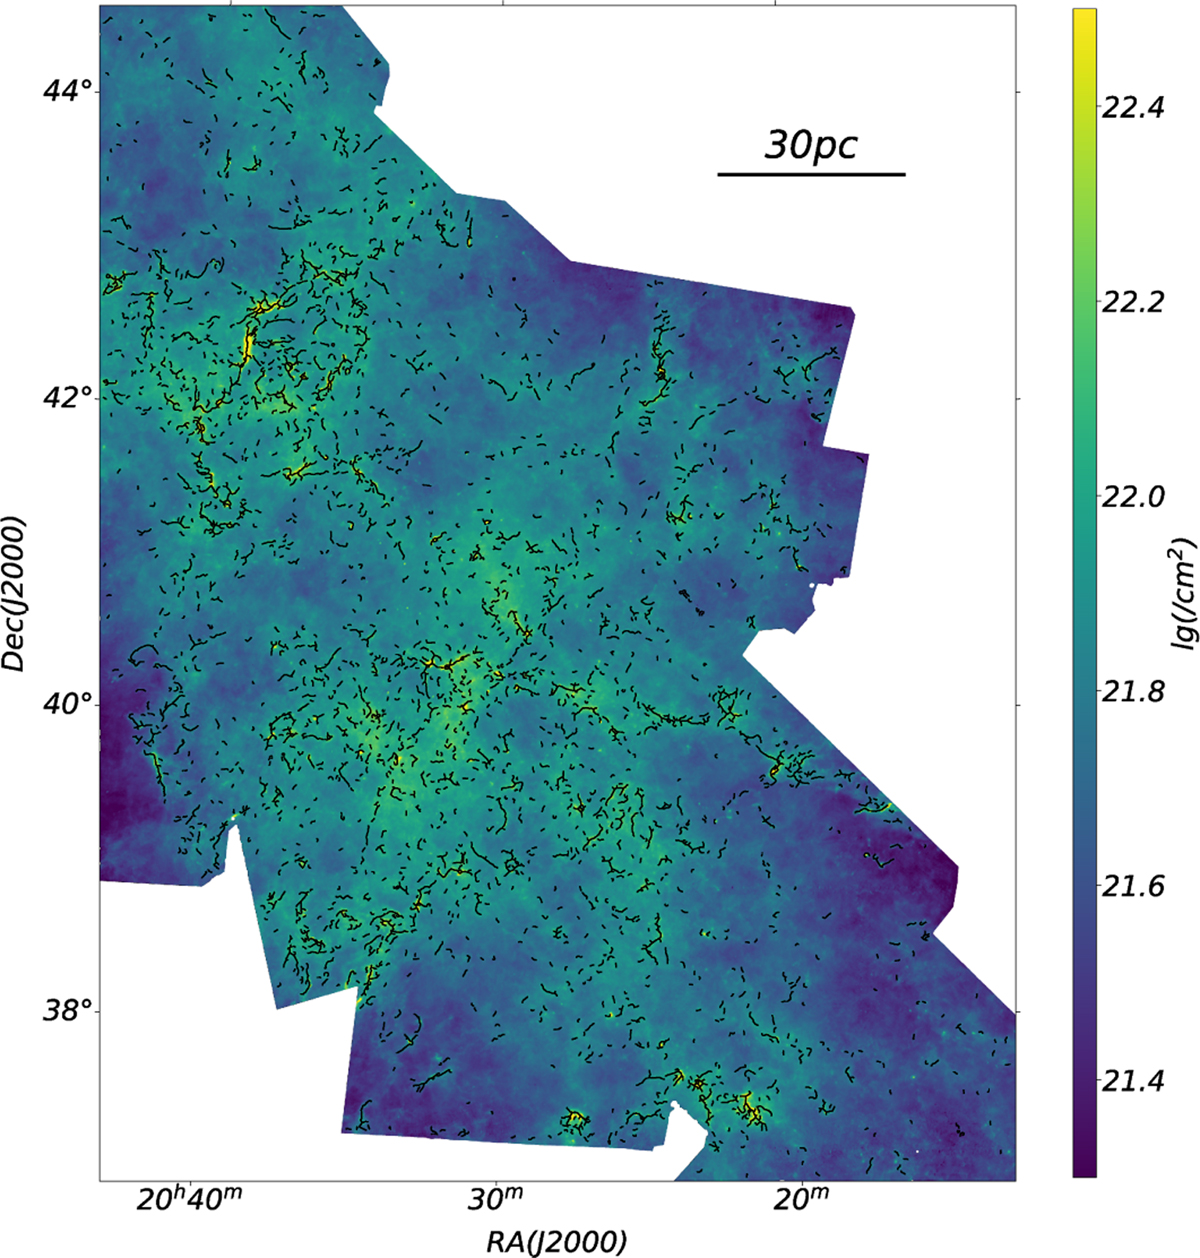
Skeletons of all filaments extracted with getsf are shown by black lines. The background is the column-density map of Cygnus X, which was derived by Cao et al. (2019) with the Herschel multi-band dust-continuum-emission maps.
Current usage metrics show cumulative count of Article Views (full-text article views including HTML views, PDF and ePub downloads, according to the available data) and Abstracts Views on Vision4Press platform.
Data correspond to usage on the plateform after 2015. The current usage metrics is available 48-96 hours after online publication and is updated daily on week days.
Initial download of the metrics may take a while.