Fig. 11
Download original image
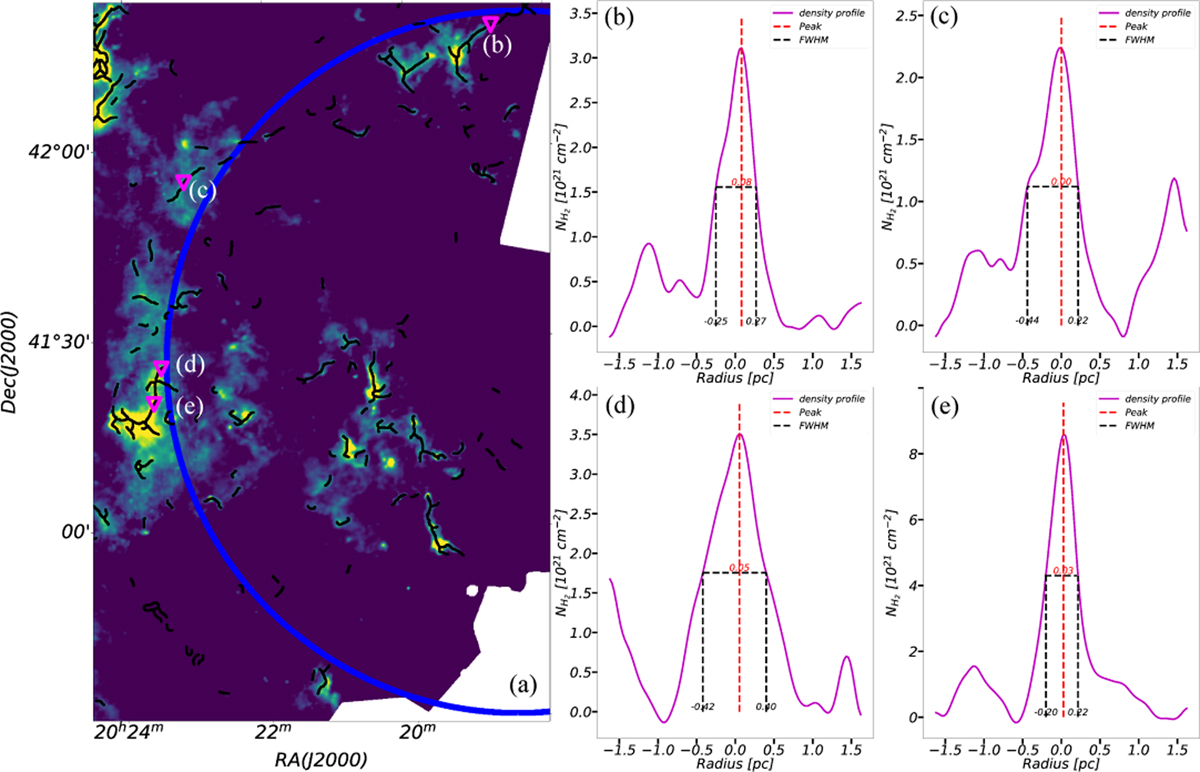
(a) No.4 HII region (blue circle) and the surrounding filaments (black solid lines, see Fig. 6 for details). The four inverted magenta triangles symbolize the positions where the column-density profiles were extracted; and they are shown in the right panels. b) to e) Four column-density profiles at corresponding positions as labeled in the left panel. The vertical dashed red line marks the position of the peak column-density, while vertical dashed black lines indicate the radii at which the column-density drops to half of its maximum value. The numerical values annotated along the vertical lines specify the corresponding radii of the two half-maximum points, as well as the peak position. Note that the column-density profiles show a steeper gradient toward the HII region (right side of the peak) and a flatter gradient away from it (left side of the peak), suggesting that the filaments are compressed by the expanding HII region. The widths measured at the half maximum on the left sides of the peaks are 0.33 pc, 0.44 pc, 0.47 pc, and 0.23 pc greater than 0.19 pc, 0.22 pc, 0.35 pc, and 0.19 pc on the right for panels b) to e), respectively.
Current usage metrics show cumulative count of Article Views (full-text article views including HTML views, PDF and ePub downloads, according to the available data) and Abstracts Views on Vision4Press platform.
Data correspond to usage on the plateform after 2015. The current usage metrics is available 48-96 hours after online publication and is updated daily on week days.
Initial download of the metrics may take a while.