Fig. B.1
Download original image
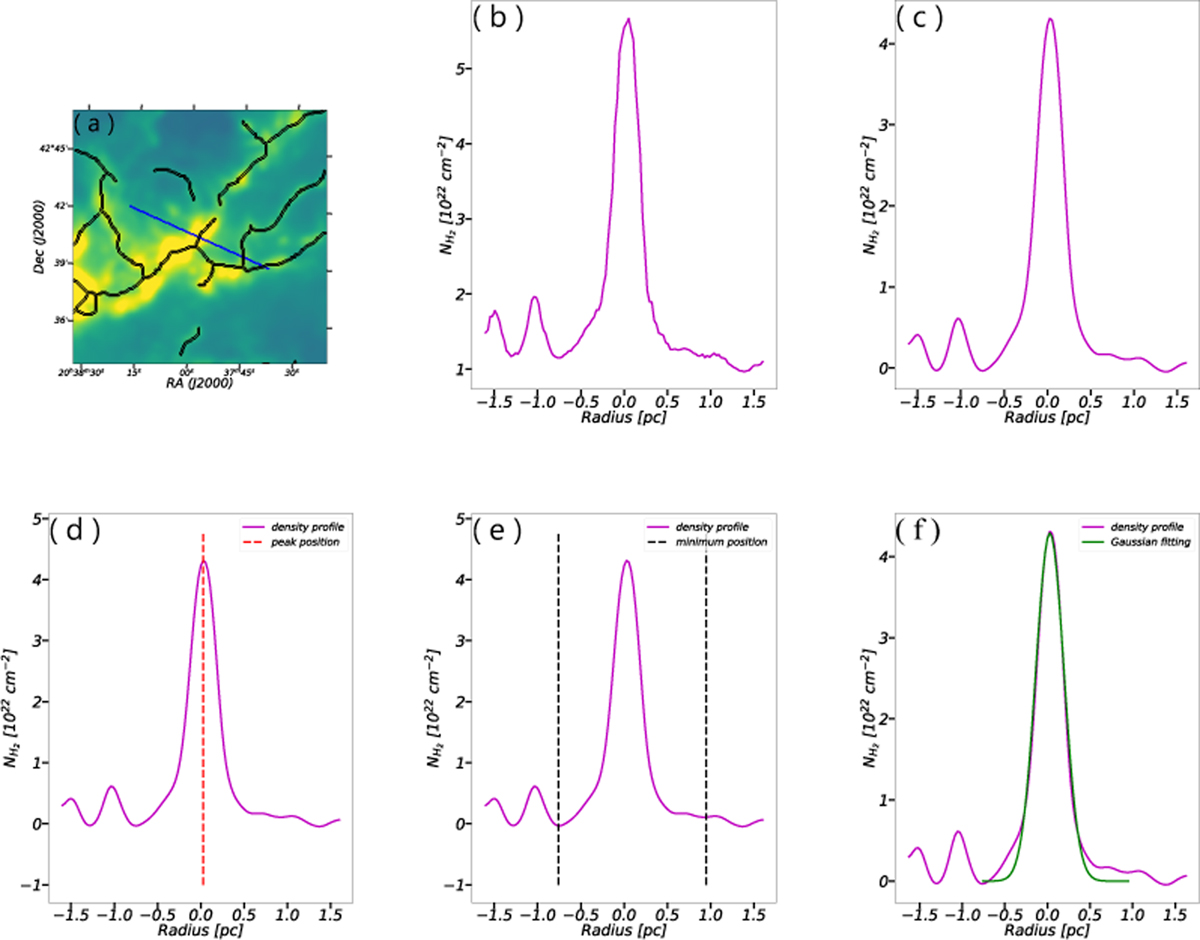
Width calculation procedure: (a) A zoom-in region cut from the column-density map with the extracted filament skeletons. The blue line represents a slice perpendicular to the skeleton. b) The original density distribution along the slice. (c) The density distribution smoothed with a Gaussian kernel of our beam size (18.4″) and then baseline subtraction. (d) Identify the peak. (e) Determine the minima nearest to the peak. (f) Gaussian fitting within the constraints determined in the previous step.
Current usage metrics show cumulative count of Article Views (full-text article views including HTML views, PDF and ePub downloads, according to the available data) and Abstracts Views on Vision4Press platform.
Data correspond to usage on the plateform after 2015. The current usage metrics is available 48-96 hours after online publication and is updated daily on week days.
Initial download of the metrics may take a while.