Fig. D.1
Download original image
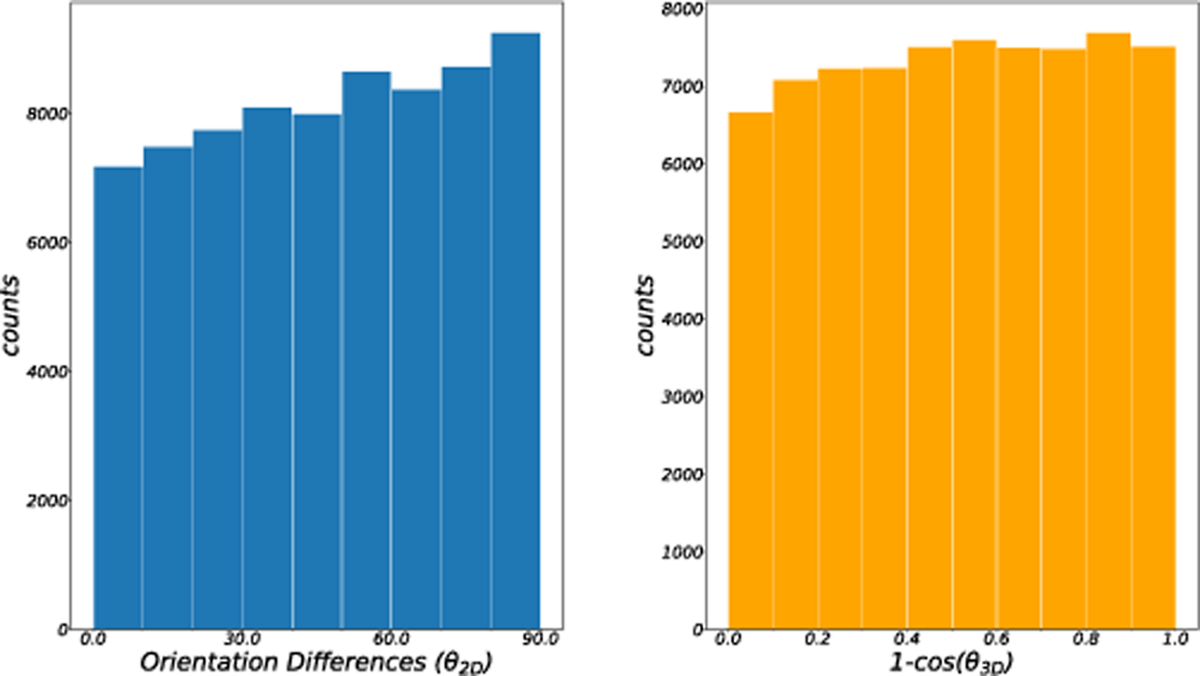
Left: the distribution of orientation differences between the B field (from Planck 353 GHz dust polarization map) and the filament skeletons (extracted on our original column-density map with a resolution of 18.4″). This distribution seems to show a perpendicular preference between the two entities. Right: the distribution of orientation differences in 3D shown as a function of 1 - cos(θ3D), where θ3D is the orientation difference angle in 3D as derived by correcting for a random inclination from θ2D, the observed orientation difference in 2D.
Current usage metrics show cumulative count of Article Views (full-text article views including HTML views, PDF and ePub downloads, according to the available data) and Abstracts Views on Vision4Press platform.
Data correspond to usage on the plateform after 2015. The current usage metrics is available 48-96 hours after online publication and is updated daily on week days.
Initial download of the metrics may take a while.