Fig. G.1
Download original image
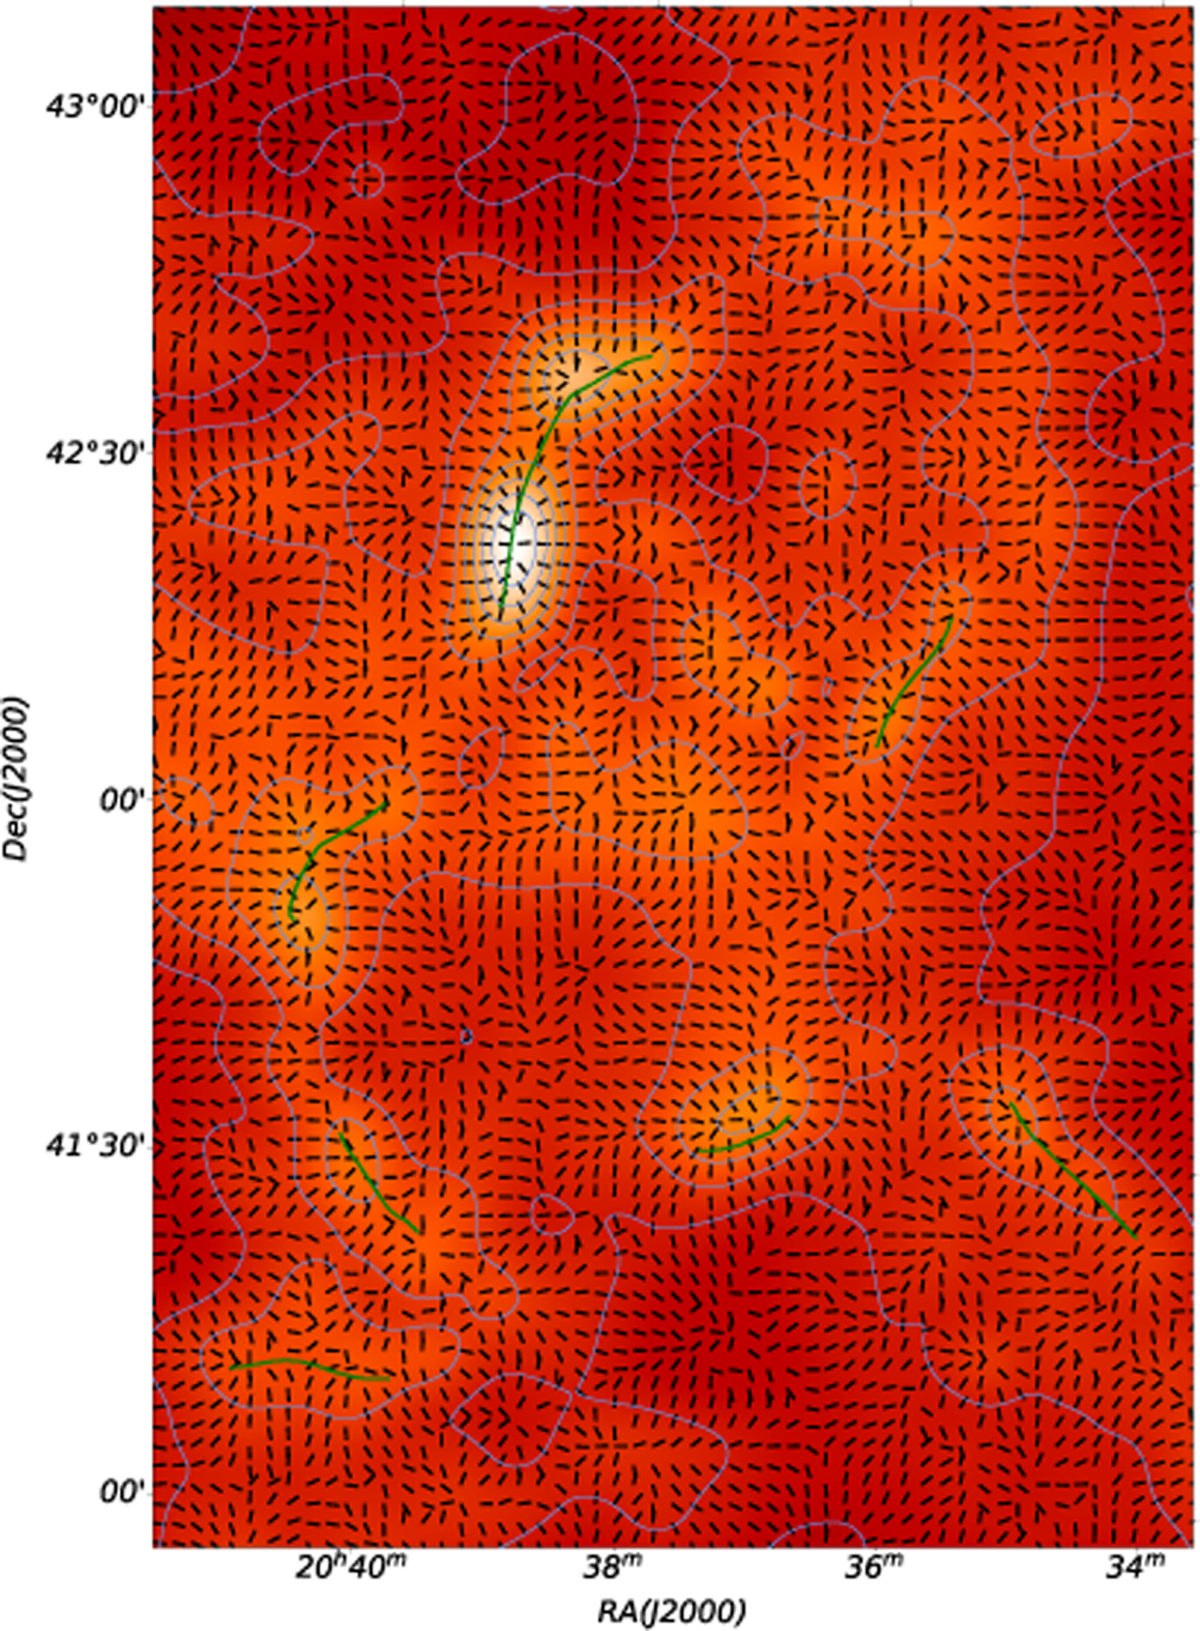
The filament skeleton extracted on the 5′ resolution columndensity map (green solid line), the density structure orientation (black segments) and the 5′ column-density map (blue contour) in a zoomin region. The two orientations (the density structure and the filament skeleton) tend to be nearly perpendicular in the vicinity of the high-density peak, whereas at lower column densities they appear to become more nearly parallel.
Current usage metrics show cumulative count of Article Views (full-text article views including HTML views, PDF and ePub downloads, according to the available data) and Abstracts Views on Vision4Press platform.
Data correspond to usage on the plateform after 2015. The current usage metrics is available 48-96 hours after online publication and is updated daily on week days.
Initial download of the metrics may take a while.