Fig. 3
Download original image
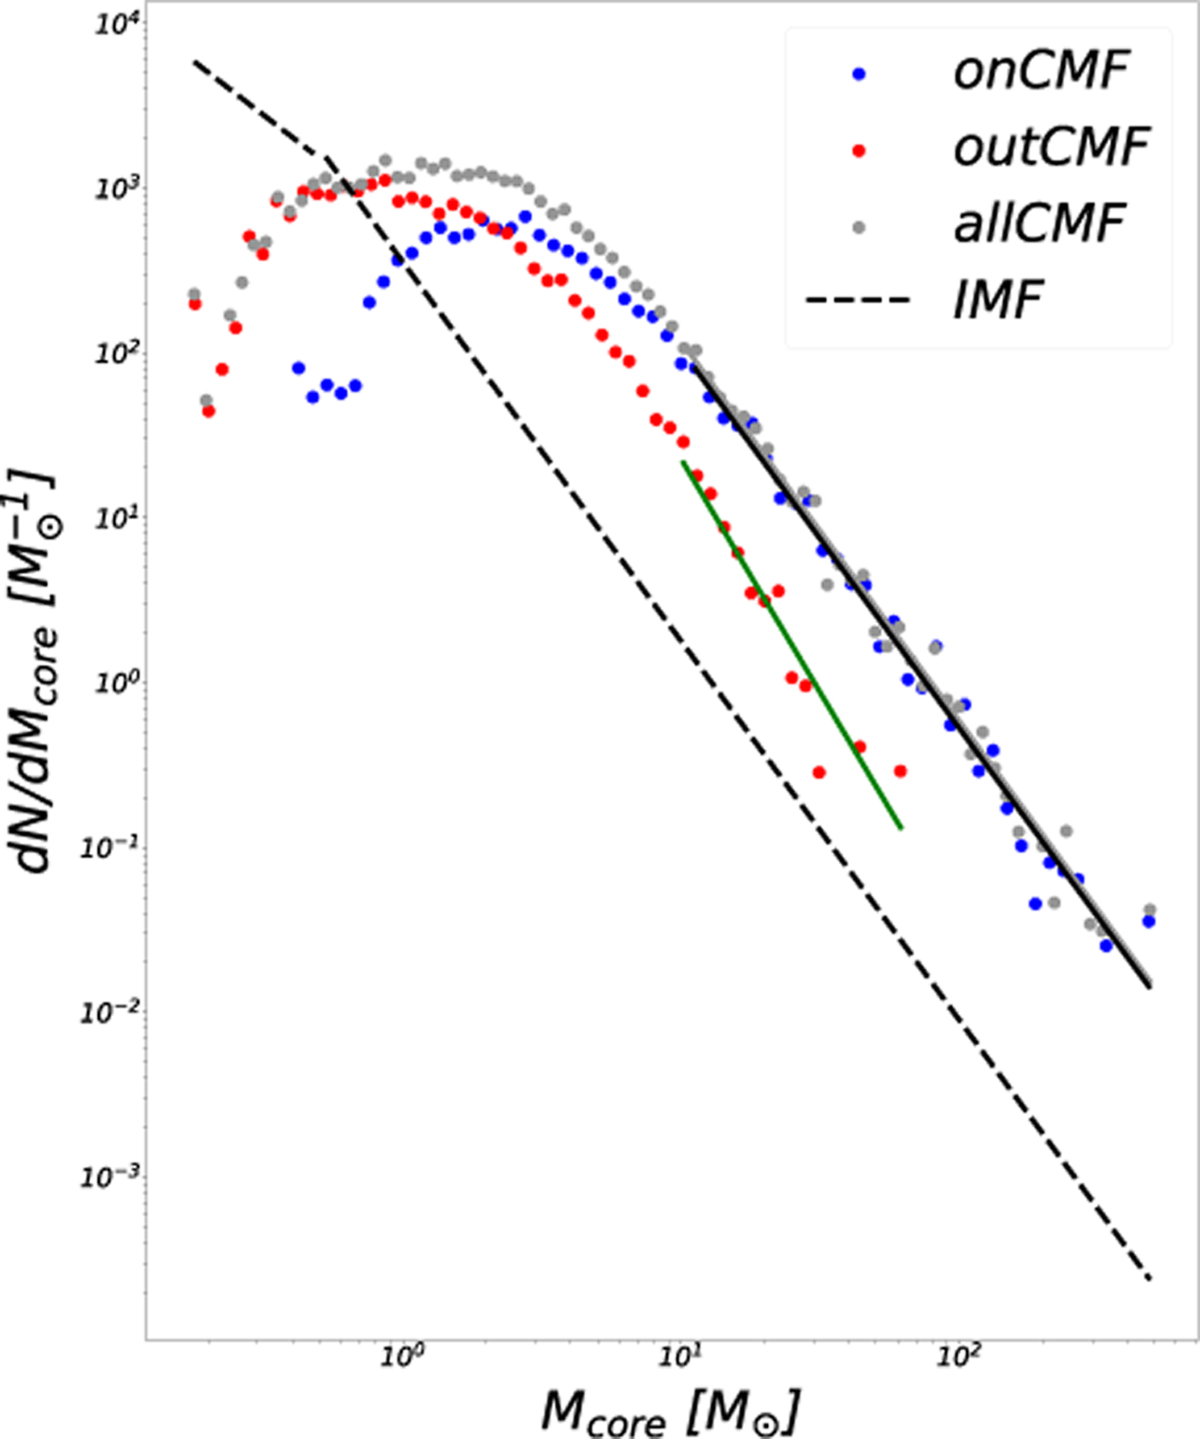
onCMF (blue dots) and outCMF (red dots) derived from the cores on and outside of filaments, respectively (Sect. 2.3). The two different power-law slopes for the two CMFs at the high-mass end (over 10 M⊙) are −2.30 and −2.83 for on CMF (black solid line) and outCMF (green solid line), respectively. This analysis highlights a tendency of high-mass cores to be preferentially located on filaments. The allCMF (gray dots) also has the similar power-law slope −2.30 at the high-mass end (over 10 M⊙). The initial mass function from Kroupa & Weidner (2003) is shown by a dashed line.
Current usage metrics show cumulative count of Article Views (full-text article views including HTML views, PDF and ePub downloads, according to the available data) and Abstracts Views on Vision4Press platform.
Data correspond to usage on the plateform after 2015. The current usage metrics is available 48-96 hours after online publication and is updated daily on week days.
Initial download of the metrics may take a while.