Fig. 6
Download original image
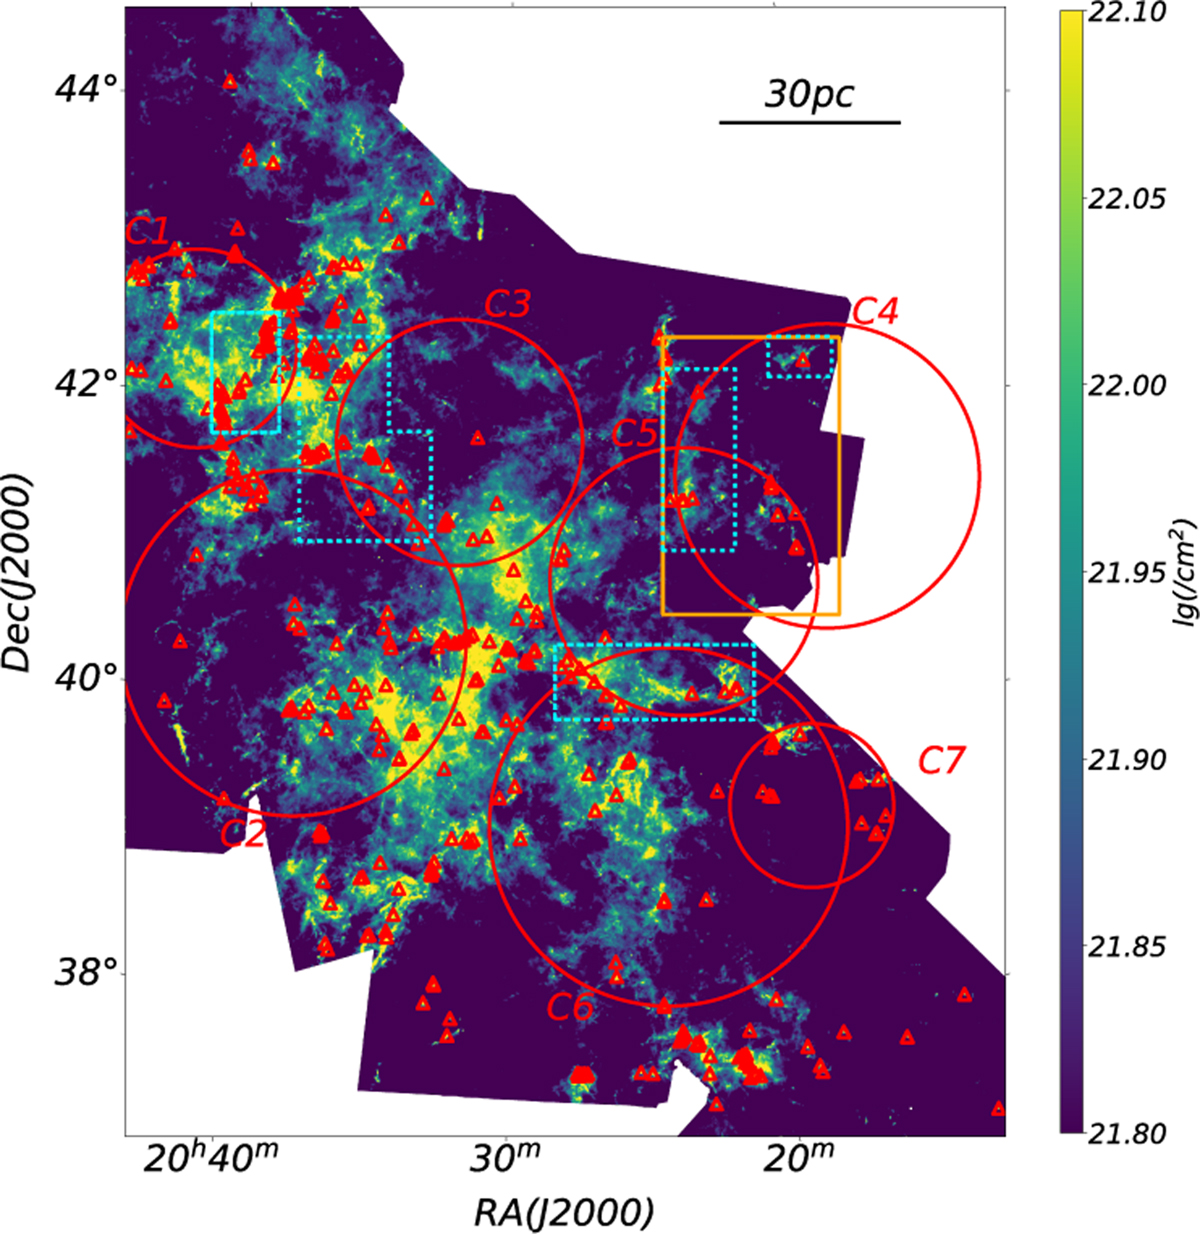
Developed HII regions (red circles numbered 1-7, Cao et al. 2019) and massive cores (red triangles) in Cygnus X. The background is the high-contrast column-density map (Cao et al. 2019). The cyan rectangles show four regions where filament ages were computed (Sect. 3.4 for details). The orange rectangle to the northwest shows evidence that filaments are compressed by the No.4 HII region (see also Sect. 3.4 for details). The majority of high-mass filaments and cores tend to be located on the boundaries of HII regions or the intersections of multiple HII regions, hinting at a strong relationship between the HII regions, filaments, and high-mass cores.
Current usage metrics show cumulative count of Article Views (full-text article views including HTML views, PDF and ePub downloads, according to the available data) and Abstracts Views on Vision4Press platform.
Data correspond to usage on the plateform after 2015. The current usage metrics is available 48-96 hours after online publication and is updated daily on week days.
Initial download of the metrics may take a while.