Open Access
Fig. 7
Download original image
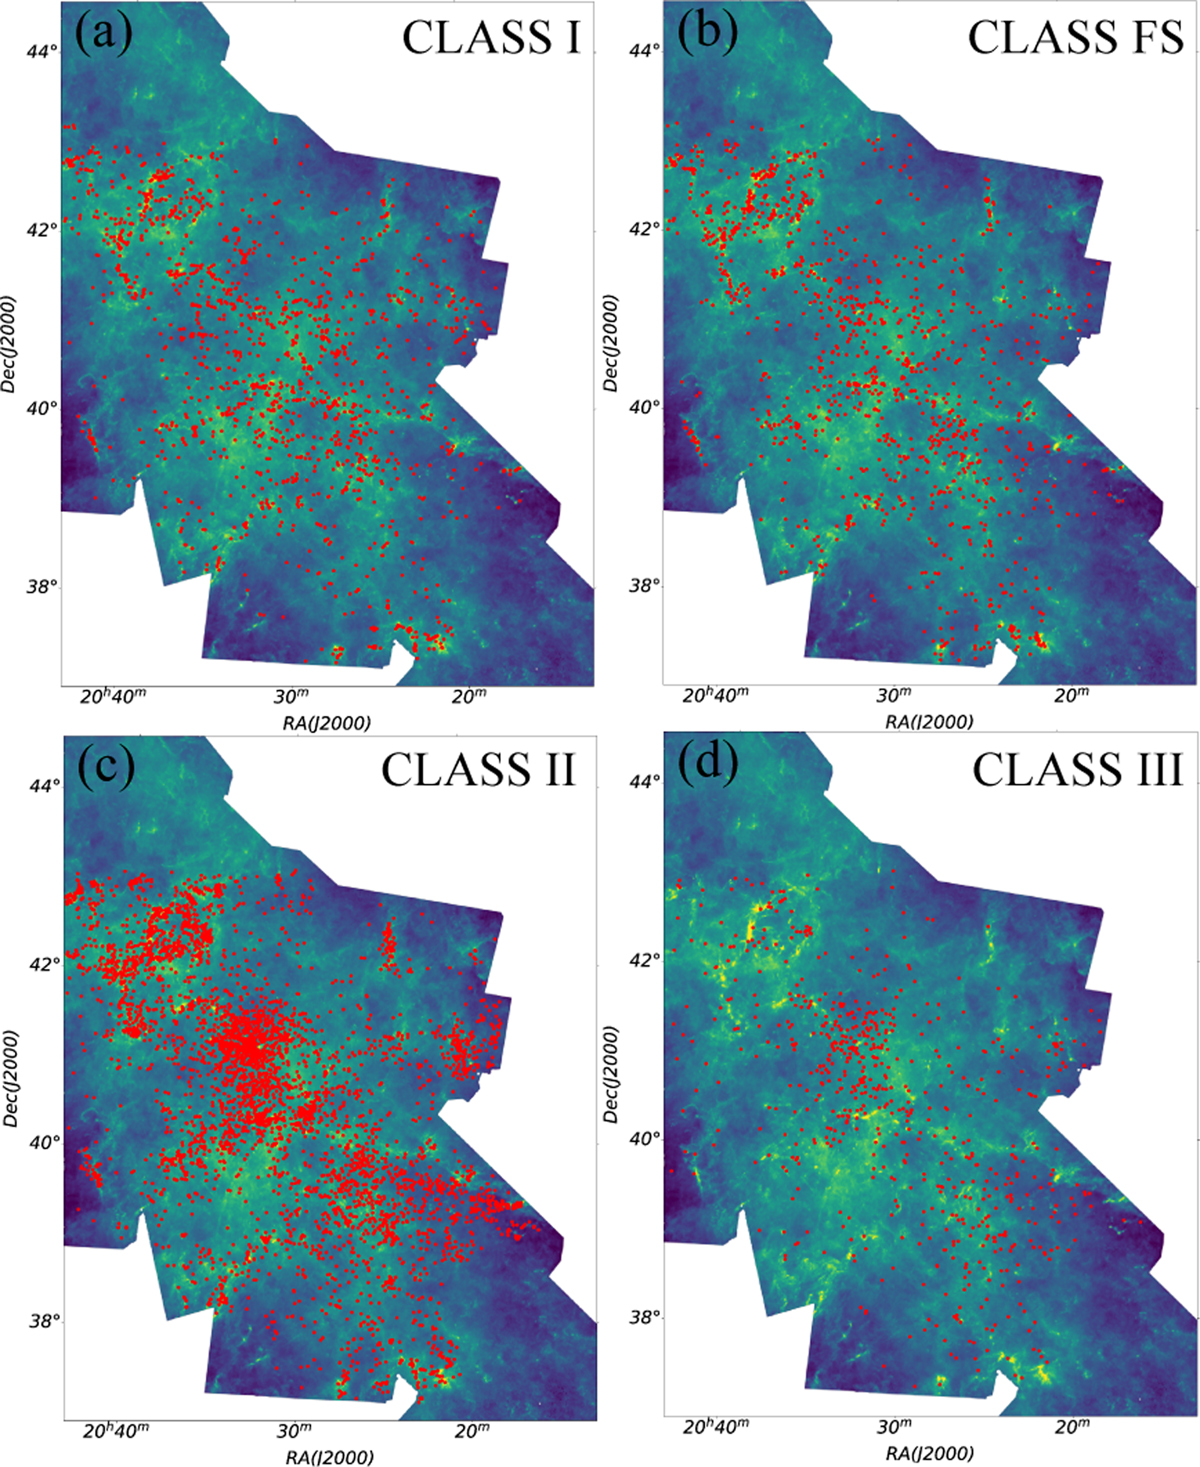
Spatial distributions of YSOs (red dots) in four evolution stages: (a) CLASS I; (b) CLASS FS; (c) CLASS II; (d) CLASS III. The background is the Herschel column-density map. YSO data were obtained from Kuhn et al. (2021). As YSOs evolve, they tend to gradually move away from filaments.
Current usage metrics show cumulative count of Article Views (full-text article views including HTML views, PDF and ePub downloads, according to the available data) and Abstracts Views on Vision4Press platform.
Data correspond to usage on the plateform after 2015. The current usage metrics is available 48-96 hours after online publication and is updated daily on week days.
Initial download of the metrics may take a while.