Open Access
Fig. 4
Download original image
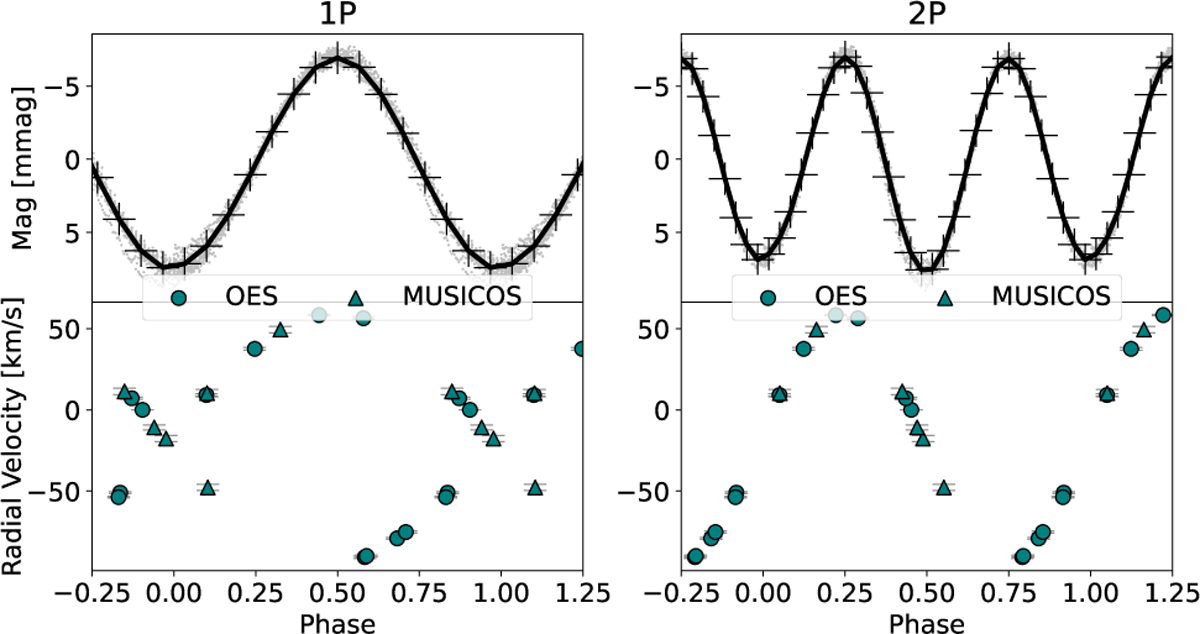
Comparison of LC (top plots) showing original (grey dots) and binned data (black crosses) and RVs (bottom plots) for a spectroscopic binary with one visible component phased with 1P (first column) and 2P (second column) - TIC 21673730.
Current usage metrics show cumulative count of Article Views (full-text article views including HTML views, PDF and ePub downloads, according to the available data) and Abstracts Views on Vision4Press platform.
Data correspond to usage on the plateform after 2015. The current usage metrics is available 48-96 hours after online publication and is updated daily on week days.
Initial download of the metrics may take a while.