Fig. 1.
Download original image
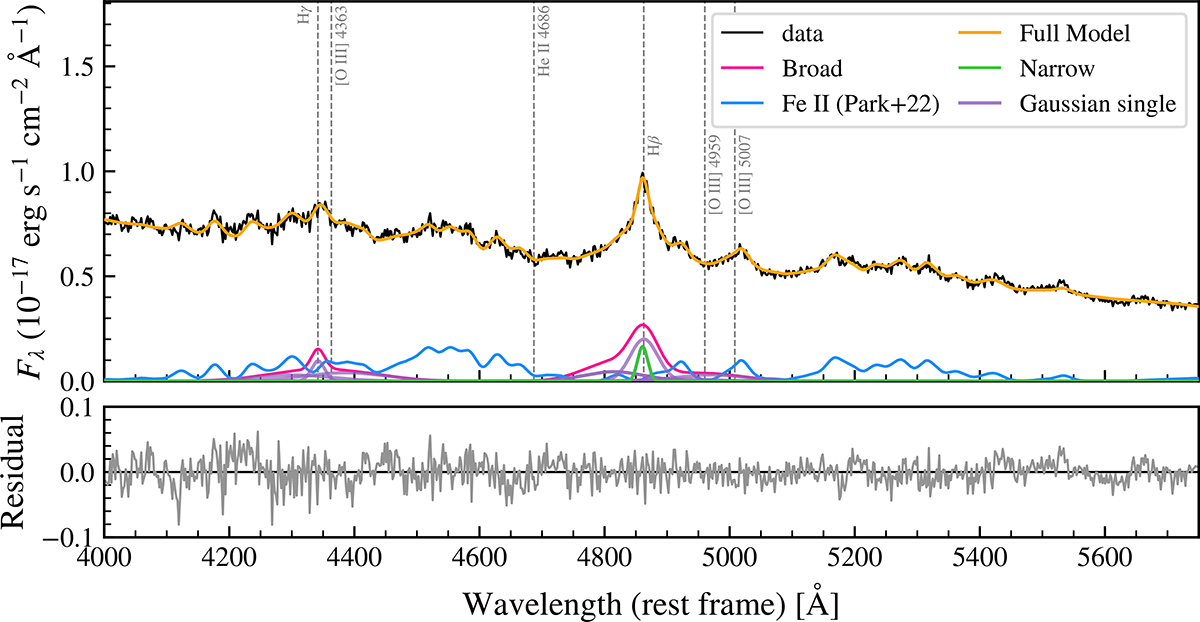
Extracted quasar spectrum within a 0![]() 35 aperture centered on the spaxel with the highest integrated flux. The observed spectrum, shown in black, is aptly fit by the PyQSOFit model, shown in orange. Broad Hβ and Hγ are modelled using three and two broad Gaussian components (pink lines, individual Gaussians are shown in purple) with FWHM > 1200 km/s, and one Gaussian component with FWHM < 1200 km/s to trace narrow components (green line). The [O III] λλ4959,5007 emission lines are modelled with one broad and one narrow component. No narrow [O III] λλ4959,5007 components are detected, whereas a strong contribution from Fe II emission (blue line) is evident (Park et al. 2022). The lower panel shows fit residuals.
35 aperture centered on the spaxel with the highest integrated flux. The observed spectrum, shown in black, is aptly fit by the PyQSOFit model, shown in orange. Broad Hβ and Hγ are modelled using three and two broad Gaussian components (pink lines, individual Gaussians are shown in purple) with FWHM > 1200 km/s, and one Gaussian component with FWHM < 1200 km/s to trace narrow components (green line). The [O III] λλ4959,5007 emission lines are modelled with one broad and one narrow component. No narrow [O III] λλ4959,5007 components are detected, whereas a strong contribution from Fe II emission (blue line) is evident (Park et al. 2022). The lower panel shows fit residuals.
Current usage metrics show cumulative count of Article Views (full-text article views including HTML views, PDF and ePub downloads, according to the available data) and Abstracts Views on Vision4Press platform.
Data correspond to usage on the plateform after 2015. The current usage metrics is available 48-96 hours after online publication and is updated daily on week days.
Initial download of the metrics may take a while.