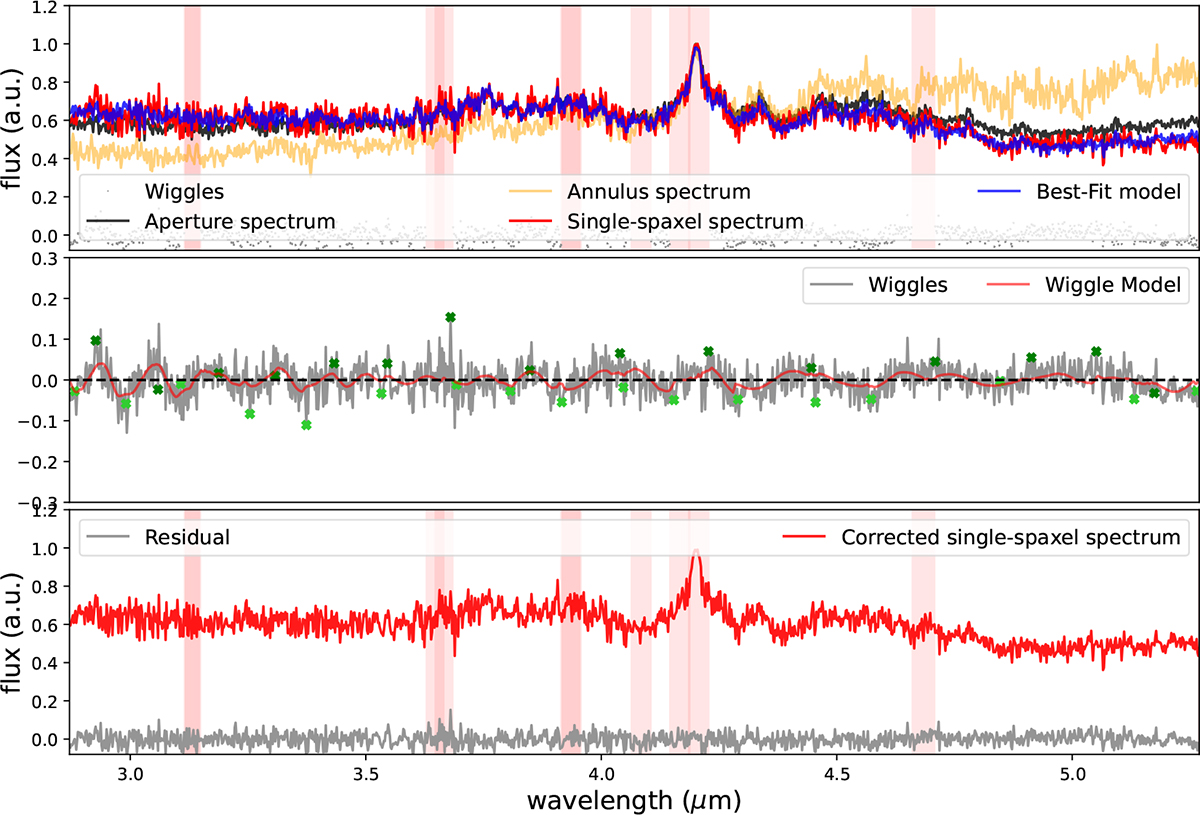
Fig. A.1.
Download original image
Correction of the brightest pixel of J0313-1806 using WICKED. Top: Brightest spaxel spectrum of J0313-1806, shown as a solid red line, fitted using a combination of an aperture and annular integrated spectra (black and yellow lines) templates, a power-law, and a second-degree polynomial, and shown in blue. Red vertical lines indicate masked regions of known emission lines excluded from the fit. The gray dots display the residuals. Middle: Wiggle spectrum is shown in gray and the best-fit wiggle model in red. The green X’s are the peaks and valleys of the wiggle spectrum used to divide the wiggle spectrum to constrain its model shown in red (see Dumont et al. (2025) for details). Bottom: Wiggle-corrected spectrum in red and the residuals in gray.
Current usage metrics show cumulative count of Article Views (full-text article views including HTML views, PDF and ePub downloads, according to the available data) and Abstracts Views on Vision4Press platform.
Data correspond to usage on the plateform after 2015. The current usage metrics is available 48-96 hours after online publication and is updated daily on week days.
Initial download of the metrics may take a while.