Fig. B.1.
Download original image
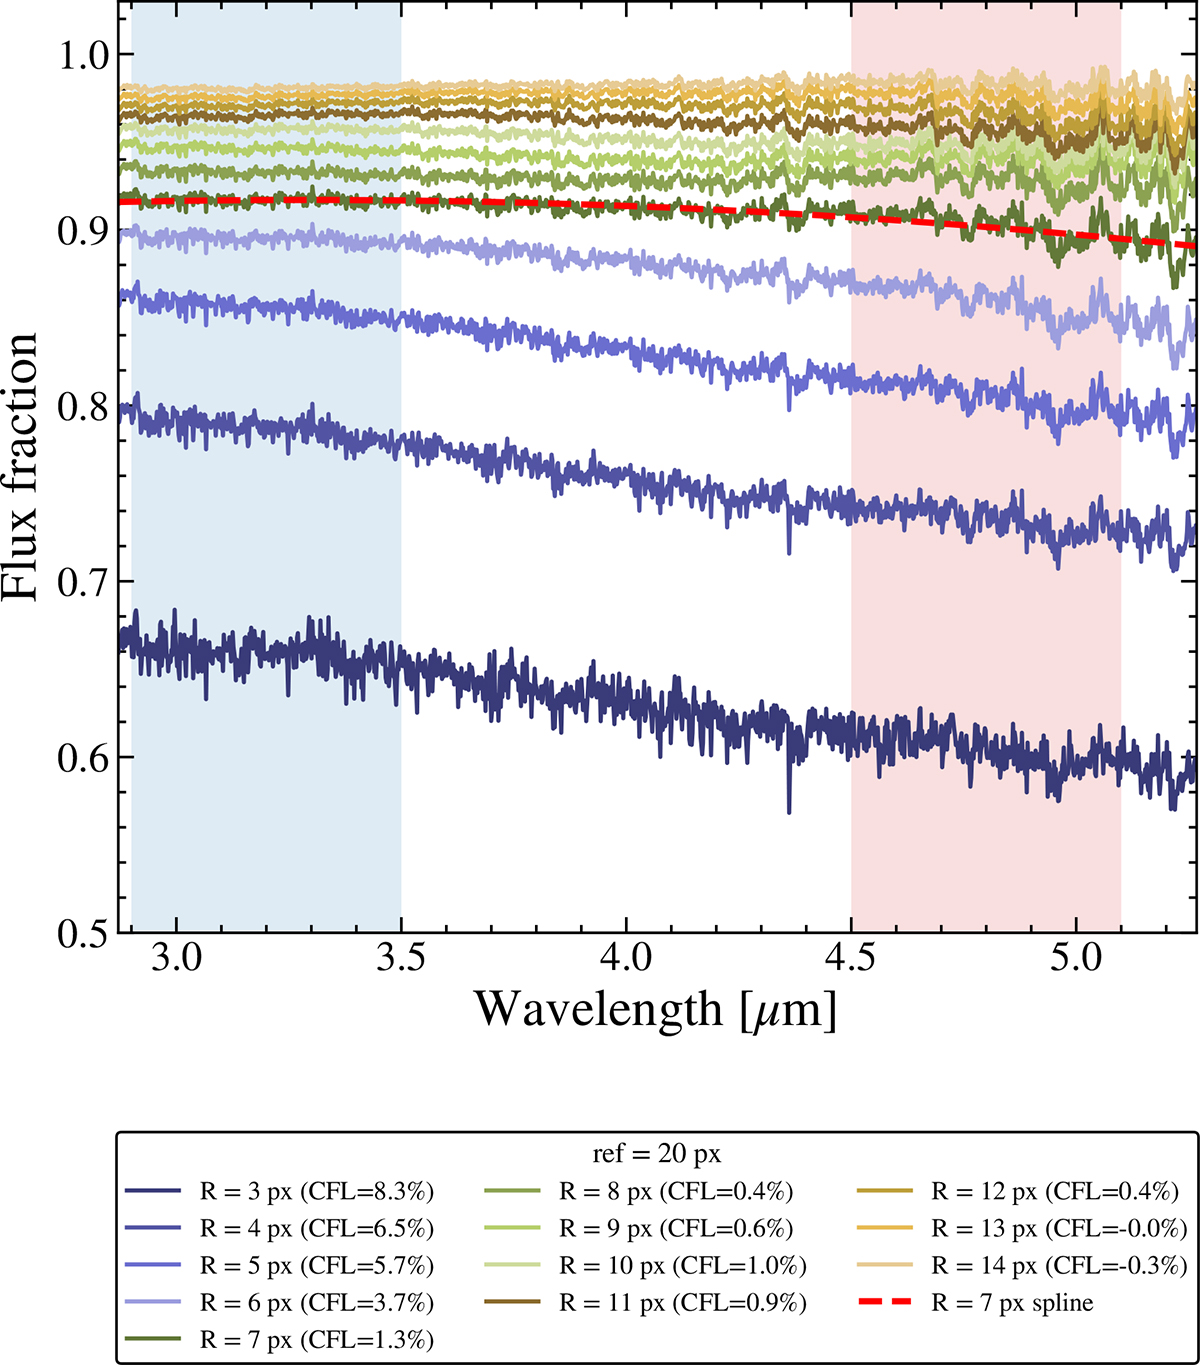
Wavelength–dependent encircled–flux fractions for different aperture radii, shown relative to a large reference aperture of 1![]() 0. The legend reports the corresponding chromatic flux losses as defined in the main text. A 7–pixel radius achieves percent-level chromatic flux loss while avoiding the increased background and extended–emission contamination present in larger apertures. The spline function fitted to the 7–pixel curve is shown as a red dashed line. The blue and red bands correspond to the regions we compute the chromatic flux losses from: (2.9–3.5 μm) and (4.5–5.1 μm.)
0. The legend reports the corresponding chromatic flux losses as defined in the main text. A 7–pixel radius achieves percent-level chromatic flux loss while avoiding the increased background and extended–emission contamination present in larger apertures. The spline function fitted to the 7–pixel curve is shown as a red dashed line. The blue and red bands correspond to the regions we compute the chromatic flux losses from: (2.9–3.5 μm) and (4.5–5.1 μm.)
Current usage metrics show cumulative count of Article Views (full-text article views including HTML views, PDF and ePub downloads, according to the available data) and Abstracts Views on Vision4Press platform.
Data correspond to usage on the plateform after 2015. The current usage metrics is available 48-96 hours after online publication and is updated daily on week days.
Initial download of the metrics may take a while.