Fig. 2.
Download original image
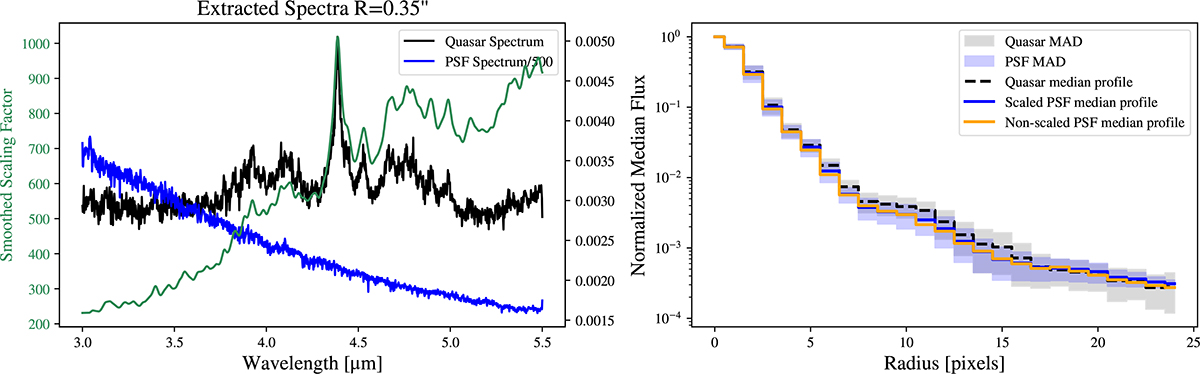
PSF model. Left: Spectral comparison between the quasar and PSF star used to derive the PSF scaling factor. The extracted 1D spectra from the quasar (black) and PSF star (blue) were obtained using a circular aperture with radius 0![]() 35. The PSF spectrum is scaled down by a factor of 500 for visual comparison. While the PSF star shows a smooth stellar continuum, the quasar exhibits a prominent broad Hβ emission line and strong Fe II features. The wavelength-dependent scaling factor S(λ) computed as the ratio between the quasar and PSF spectra is shown in green. The scaling factor is smoothed with a Gaussian kernel of width σ = 5 pix before being applied slice by slice to the aligned PSF cube. Right: Median radial profiles extracted from the quasar cube (black dashed), the raw PSF star cube (orange), and the PSF star cube, corrected with the wavelength-dependent scaling factor (blue). The radial profiles are measured from the brightest pixel in white light of each cube. The colour-shaded areas correspond to the median absolute deviations of the quasar radial profile (grey) and the scaled PSF star cube (blue).
35. The PSF spectrum is scaled down by a factor of 500 for visual comparison. While the PSF star shows a smooth stellar continuum, the quasar exhibits a prominent broad Hβ emission line and strong Fe II features. The wavelength-dependent scaling factor S(λ) computed as the ratio between the quasar and PSF spectra is shown in green. The scaling factor is smoothed with a Gaussian kernel of width σ = 5 pix before being applied slice by slice to the aligned PSF cube. Right: Median radial profiles extracted from the quasar cube (black dashed), the raw PSF star cube (orange), and the PSF star cube, corrected with the wavelength-dependent scaling factor (blue). The radial profiles are measured from the brightest pixel in white light of each cube. The colour-shaded areas correspond to the median absolute deviations of the quasar radial profile (grey) and the scaled PSF star cube (blue).
Current usage metrics show cumulative count of Article Views (full-text article views including HTML views, PDF and ePub downloads, according to the available data) and Abstracts Views on Vision4Press platform.
Data correspond to usage on the plateform after 2015. The current usage metrics is available 48-96 hours after online publication and is updated daily on week days.
Initial download of the metrics may take a while.