Fig. 5.
Download original image
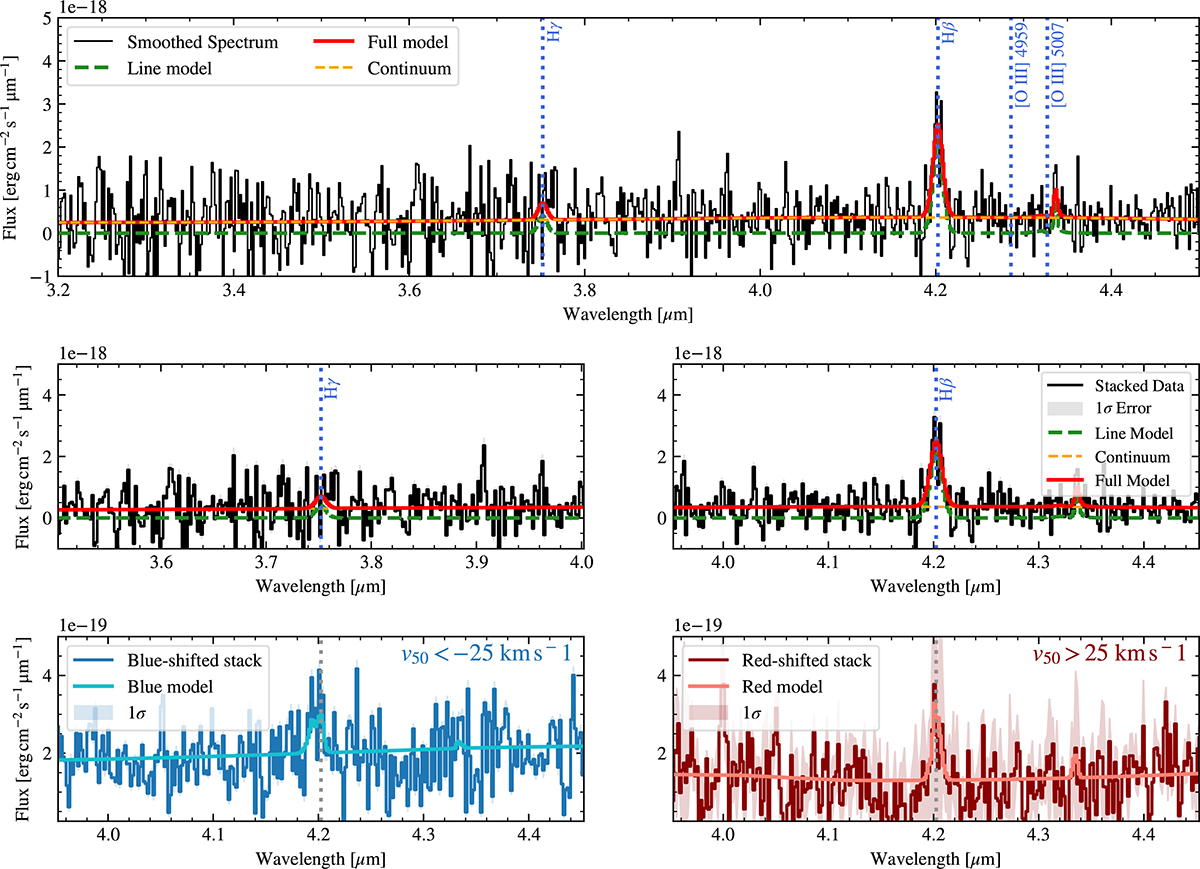
Upper panel: Mean spectrum of the Balmer shell. This spectrum was extracted from 57 spaxels with at least 3σ Hβ detections. The line (green dashed line), the continuum (orange dashed line), and the full (red line) models are from our q3dfit analysis. The fitted, redshifted [O III] λ5007 and continuum emissions are consistent with noise. Middle panel: Zoom in spectra of the Hγ and Hβ regions. Lower panels: Mean spectra of blueshifted (v50 < −25 km s−1, left) and redshifted (v50 > 25 km s−1, right) Hβ spaxels.
Current usage metrics show cumulative count of Article Views (full-text article views including HTML views, PDF and ePub downloads, according to the available data) and Abstracts Views on Vision4Press platform.
Data correspond to usage on the plateform after 2015. The current usage metrics is available 48-96 hours after online publication and is updated daily on week days.
Initial download of the metrics may take a while.