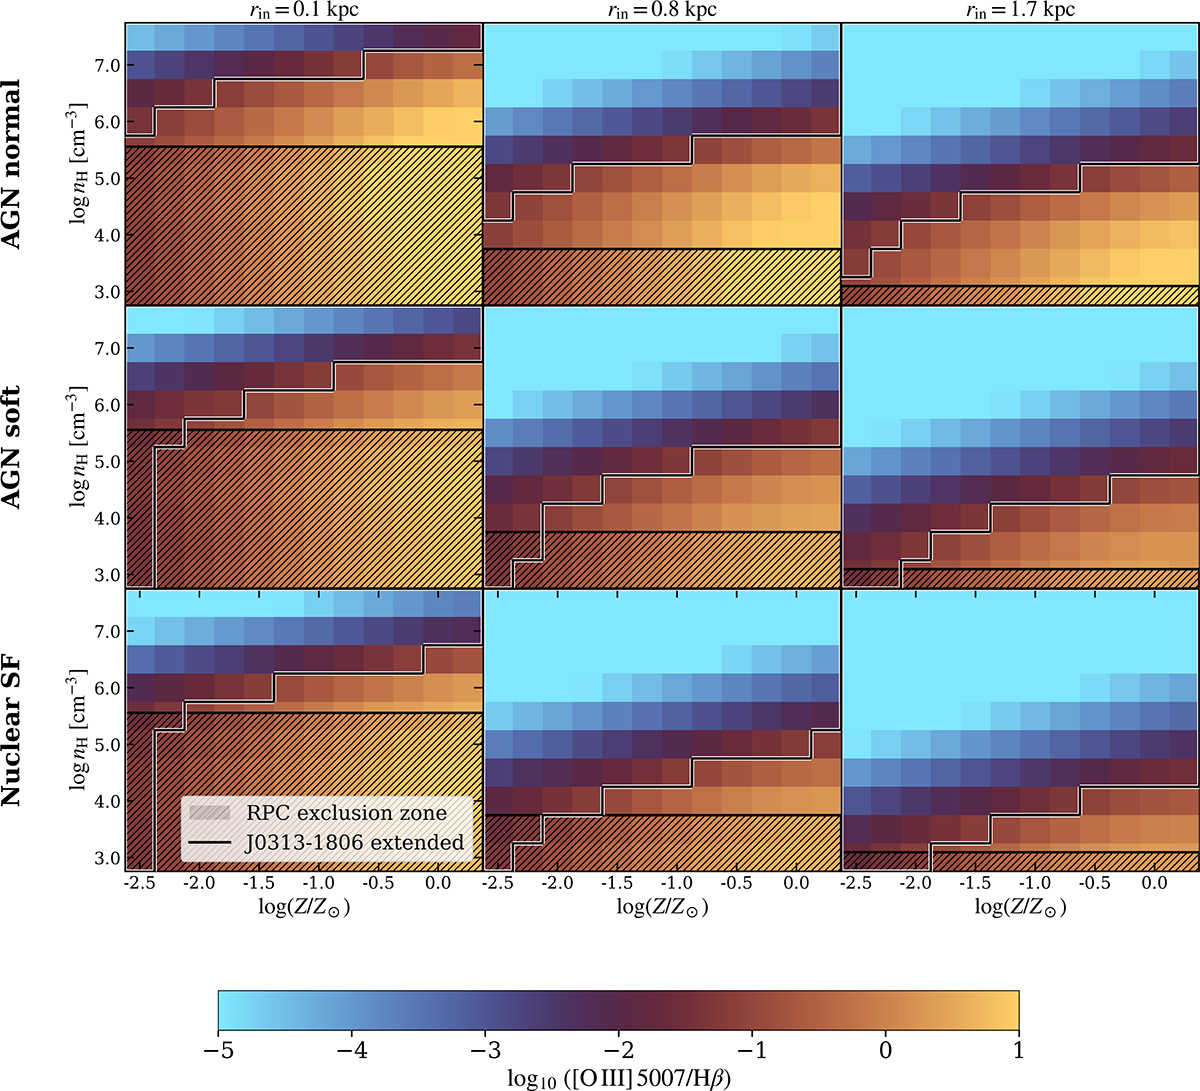
Fig. 9.
Download original image
Cloudy simulation results for the Hβ shell. Top and middle rows correspond to models using the AGN normal and AGN soft continua as ionizing sources, respectively, while the lower row corresponds to the stellar ionizing source. Each panel shows the predicted line ratio log10([O III] 5007/Hβ) as a function of gas density, nH, and metallicity, Z, for inner shell radii of rin = 0.1, 0.8, and 1.7 kpc (left to right). The maps are spanned by constant-density shell models with outer radius rout = 1.8 kpc. Regions enclosed by the black contour are consistent with the observed constraint log10([O III]/Hβ) < −1.15 from the extended emission in J0313-1806. The hatched areas indicate the radiation–pressure confinement (RPC) exclusion zone, where densities fall below the expected RPC floor and are therefore disfavored.
Current usage metrics show cumulative count of Article Views (full-text article views including HTML views, PDF and ePub downloads, according to the available data) and Abstracts Views on Vision4Press platform.
Data correspond to usage on the plateform after 2015. The current usage metrics is available 48-96 hours after online publication and is updated daily on week days.
Initial download of the metrics may take a while.