Fig. 1.
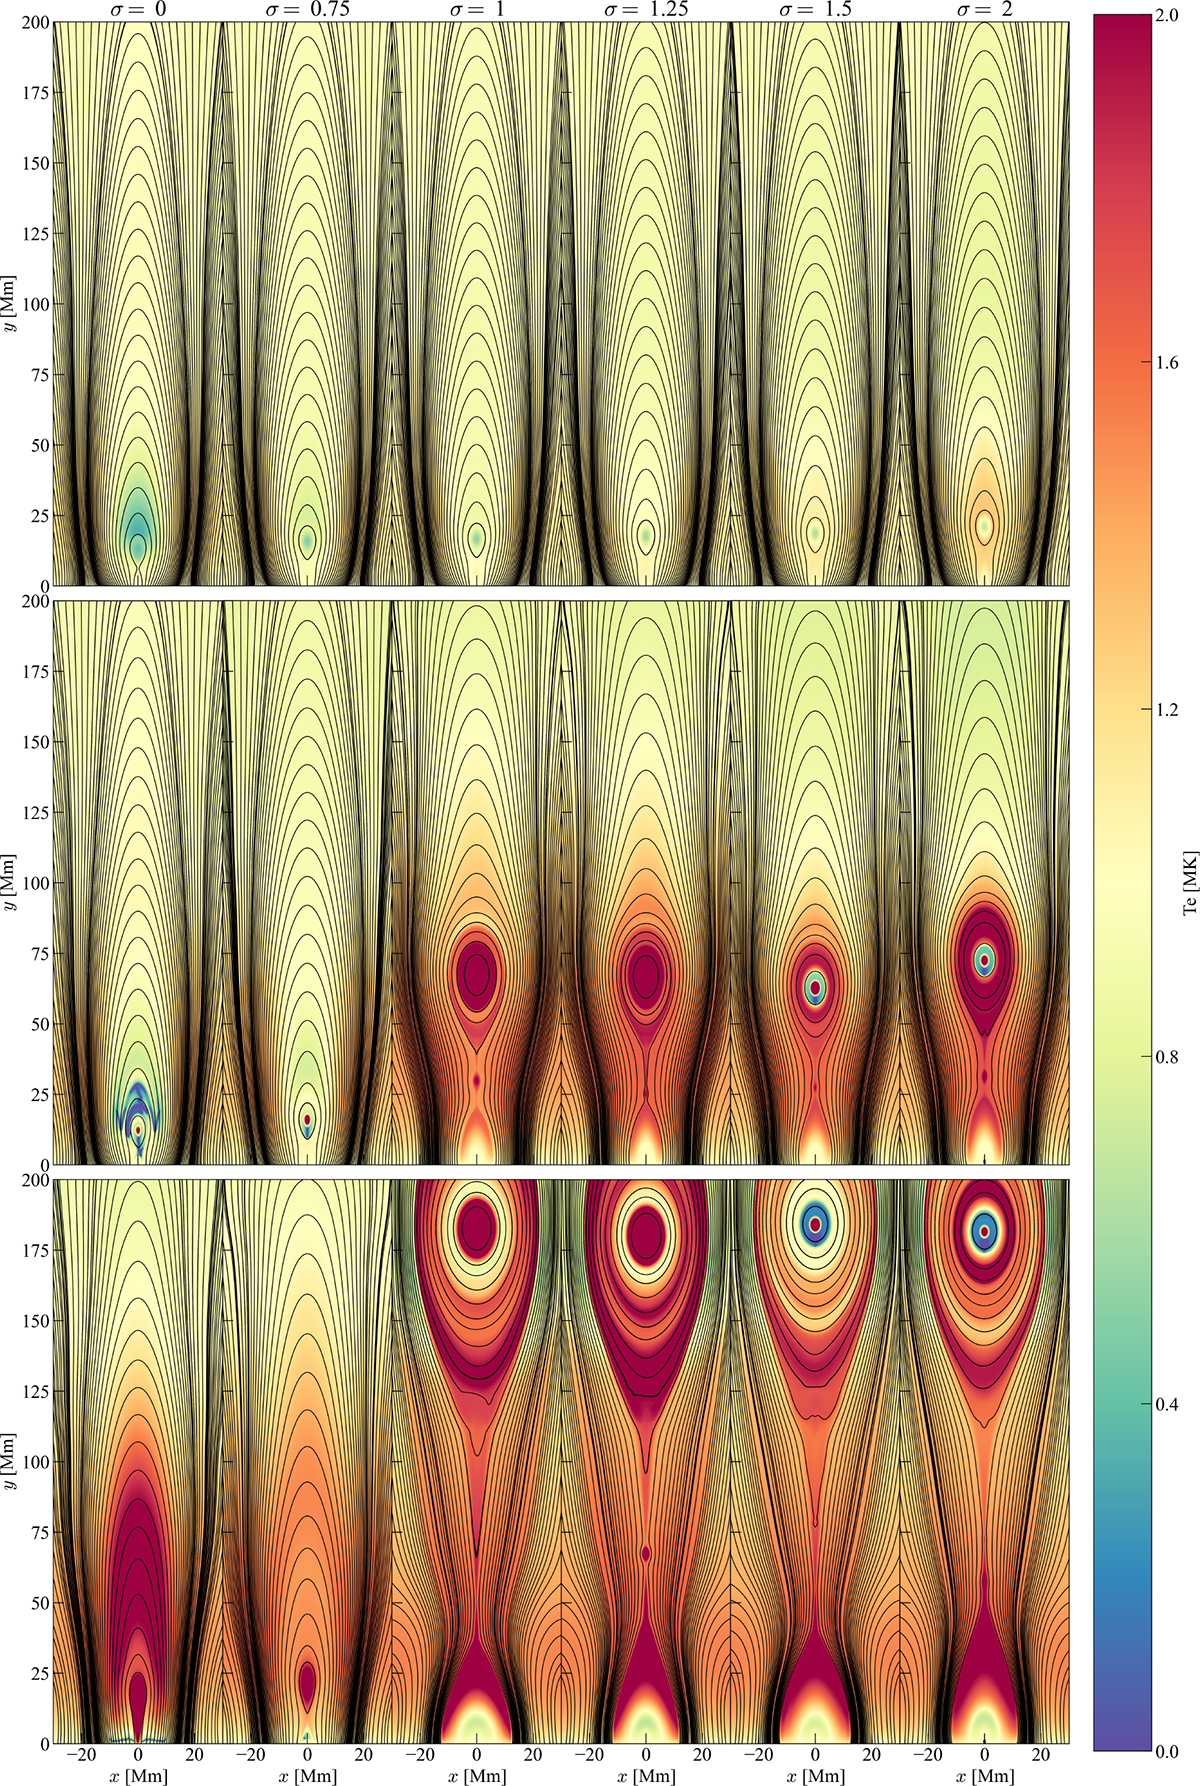
Download original image
Temperature evolution of the six simulations. From left to right, columns correspond to simulations with σ ∈ {0, 0.75, 1, 1.25, 1.5, 2}. Top row: Snapshots of the simulations at the time at which footpoint driving motion is disabled t = t1. Middle row: Formation of coronal rain (σ = 0), solar prominences (σ = 0 and 0.75), and plasmoids (σ ∈ {1, 1.25, 1.5, 2}). Bottom row: Final snapshot of each simulation. Thin black lines indicate magnetic field lines. The final snapshot occurs at different timestamps for the different σ cases: 253 min (σ ∈ {0, 0.75, 1}), 257 min (σ = 1.25), 234 min (σ = 1.5), and 232 min (σ = 2). An animation of this figure is available https://www.aanda.org/10.1051/0004-6361/202557941/olm.
Current usage metrics show cumulative count of Article Views (full-text article views including HTML views, PDF and ePub downloads, according to the available data) and Abstracts Views on Vision4Press platform.
Data correspond to usage on the plateform after 2015. The current usage metrics is available 48-96 hours after online publication and is updated daily on week days.
Initial download of the metrics may take a while.