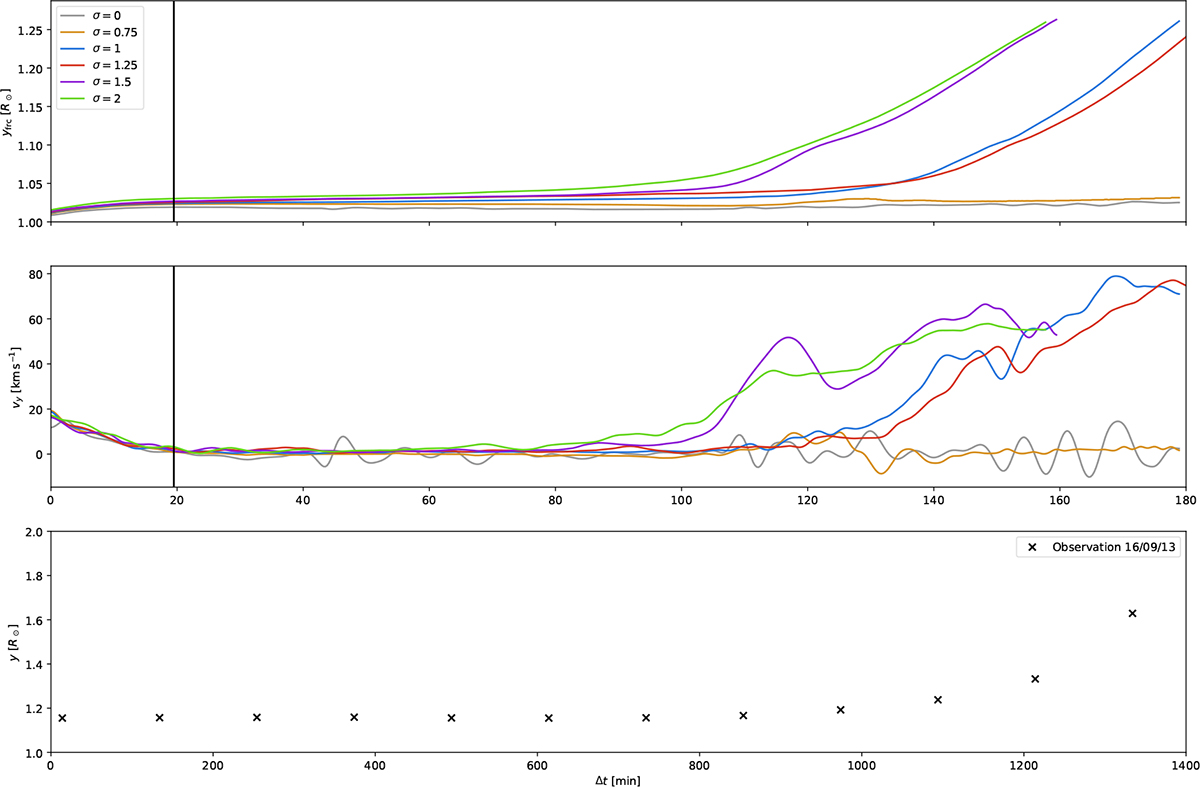
Fig. 2.
Download original image
Flux rope evolution for the six shearing cases. Top panel: Height y of the flux rope centers in units of solar radius. Middle panel: Vertical velocity vy in km/s. The time axis is defined as Δ t = t − tfr, where Δ t represents the time elapsed since the flux rope formation. The vertical black line marks the time at which footpoint driving motion is disabled (t = t1 or Δ t = t1 − tfr). Bottom panel: Height evolution of an observed erupting prominence, using data from Di Lorenzo et al. (2025). The final data point of all curves corresponds to the moment when the flux rope center crosses the altitude y = 200 Mm.
Current usage metrics show cumulative count of Article Views (full-text article views including HTML views, PDF and ePub downloads, according to the available data) and Abstracts Views on Vision4Press platform.
Data correspond to usage on the plateform after 2015. The current usage metrics is available 48-96 hours after online publication and is updated daily on week days.
Initial download of the metrics may take a while.