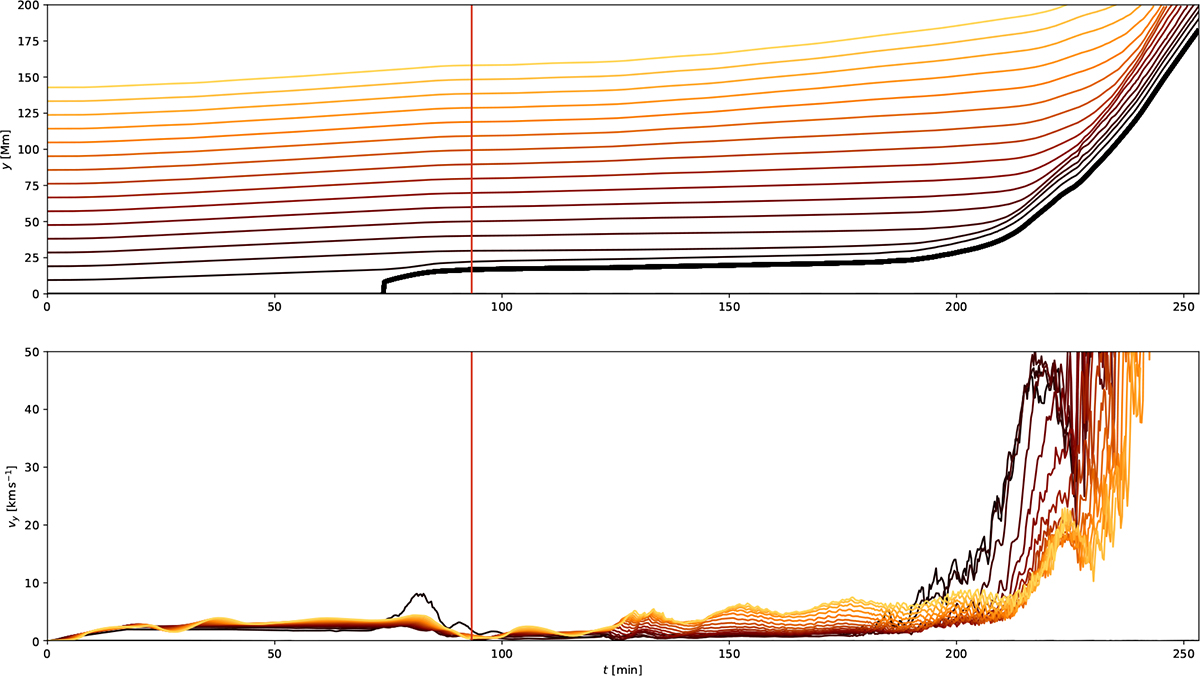
Fig. 3.
Download original image
Height y in megameters (top panel) and vertical velocity vy in kilometers per second (bottom panel) of the central arcades’ apexes in function of time t in minutes for σ = 1. Colors ranging from black to orange correspond to lower-lying arcades to higher-lying arcades, respectively. The thick black line corresponds to the evolution of the flux rope center. The vertical red line marks the time at which footpoint driving is disabled (t = t1).
Current usage metrics show cumulative count of Article Views (full-text article views including HTML views, PDF and ePub downloads, according to the available data) and Abstracts Views on Vision4Press platform.
Data correspond to usage on the plateform after 2015. The current usage metrics is available 48-96 hours after online publication and is updated daily on week days.
Initial download of the metrics may take a while.