Fig. 4.
Download original image
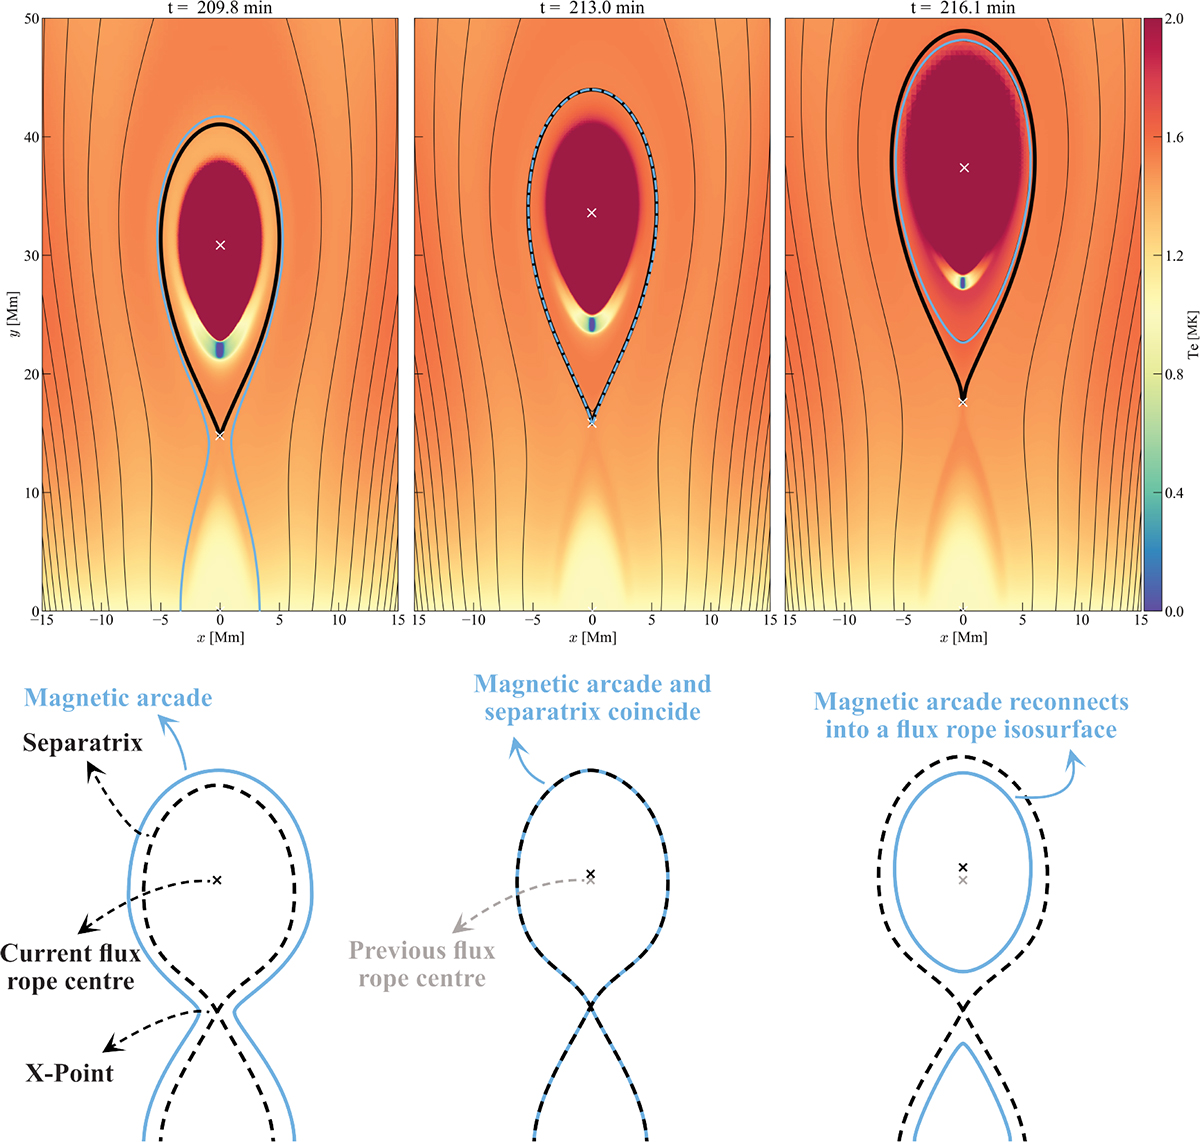
Demonstration of how magnetic reconnection expands the flux rope and shifts its center. Top row: Temperature evolution in megakelvin (MK) for σ = 1. Thin black lines trace magnetic arcades, the thick black line marks the separatrix, and the blue line marks a tracked magnetic arcade that eventually reconnects into a closed magnetic field line. The top white cross marks the flux rope center, defined as the only point within the flux rope with a vanishing magnetic curvature. The lower white cross marks the X-point, defined as another isolated point with zero magnetic curvature. Bottom row: Schematic cartoon illustrating the ongoing process from our simulation in a simplified manner.
Current usage metrics show cumulative count of Article Views (full-text article views including HTML views, PDF and ePub downloads, according to the available data) and Abstracts Views on Vision4Press platform.
Data correspond to usage on the plateform after 2015. The current usage metrics is available 48-96 hours after online publication and is updated daily on week days.
Initial download of the metrics may take a while.